All Microwave examples
MICROWAVE FDTD STUDIO · APPLICATION EXAMPLE

Rectangular waveguide filter · 9 GHz

Explore the device model, recorded field evolution and original response exports in Microwave FDTD Studio.

01 · MODEL & PORTS

Model & ports
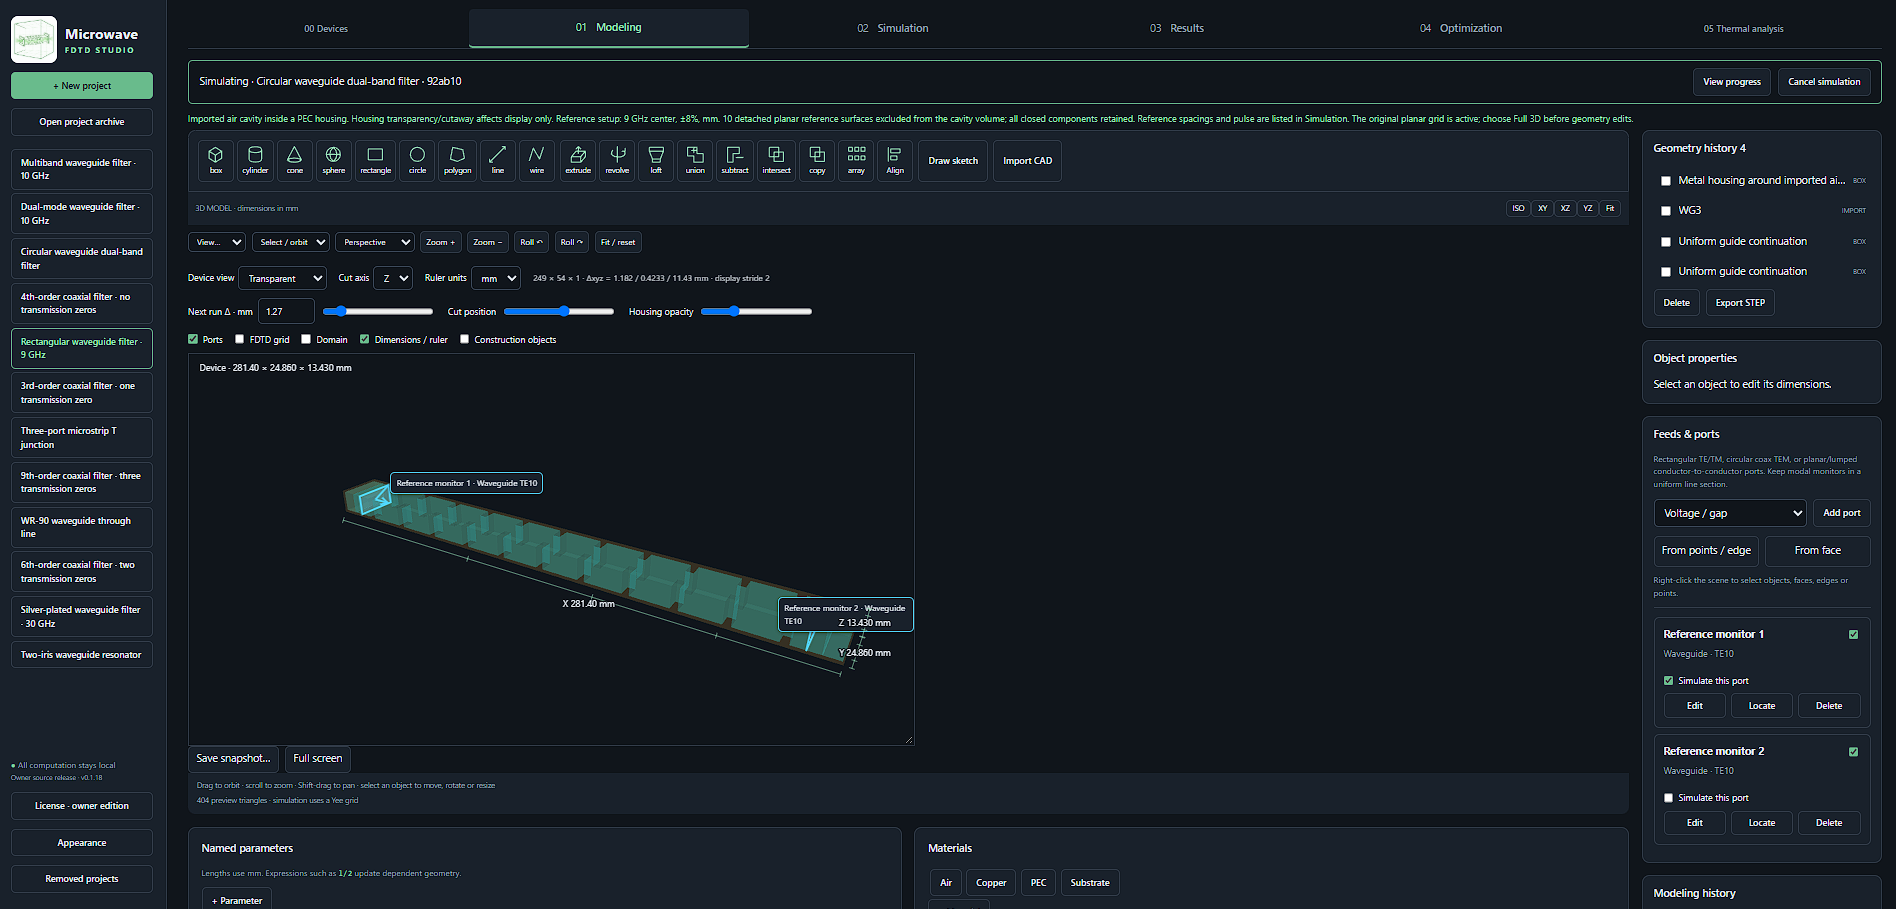
Rectangular waveguide filter · 9 GHz selected in the Microwave FDTD Studio modeling interface
Modeling workspaceOriginal modeling workspace showing the selected device, geometry and port setup.
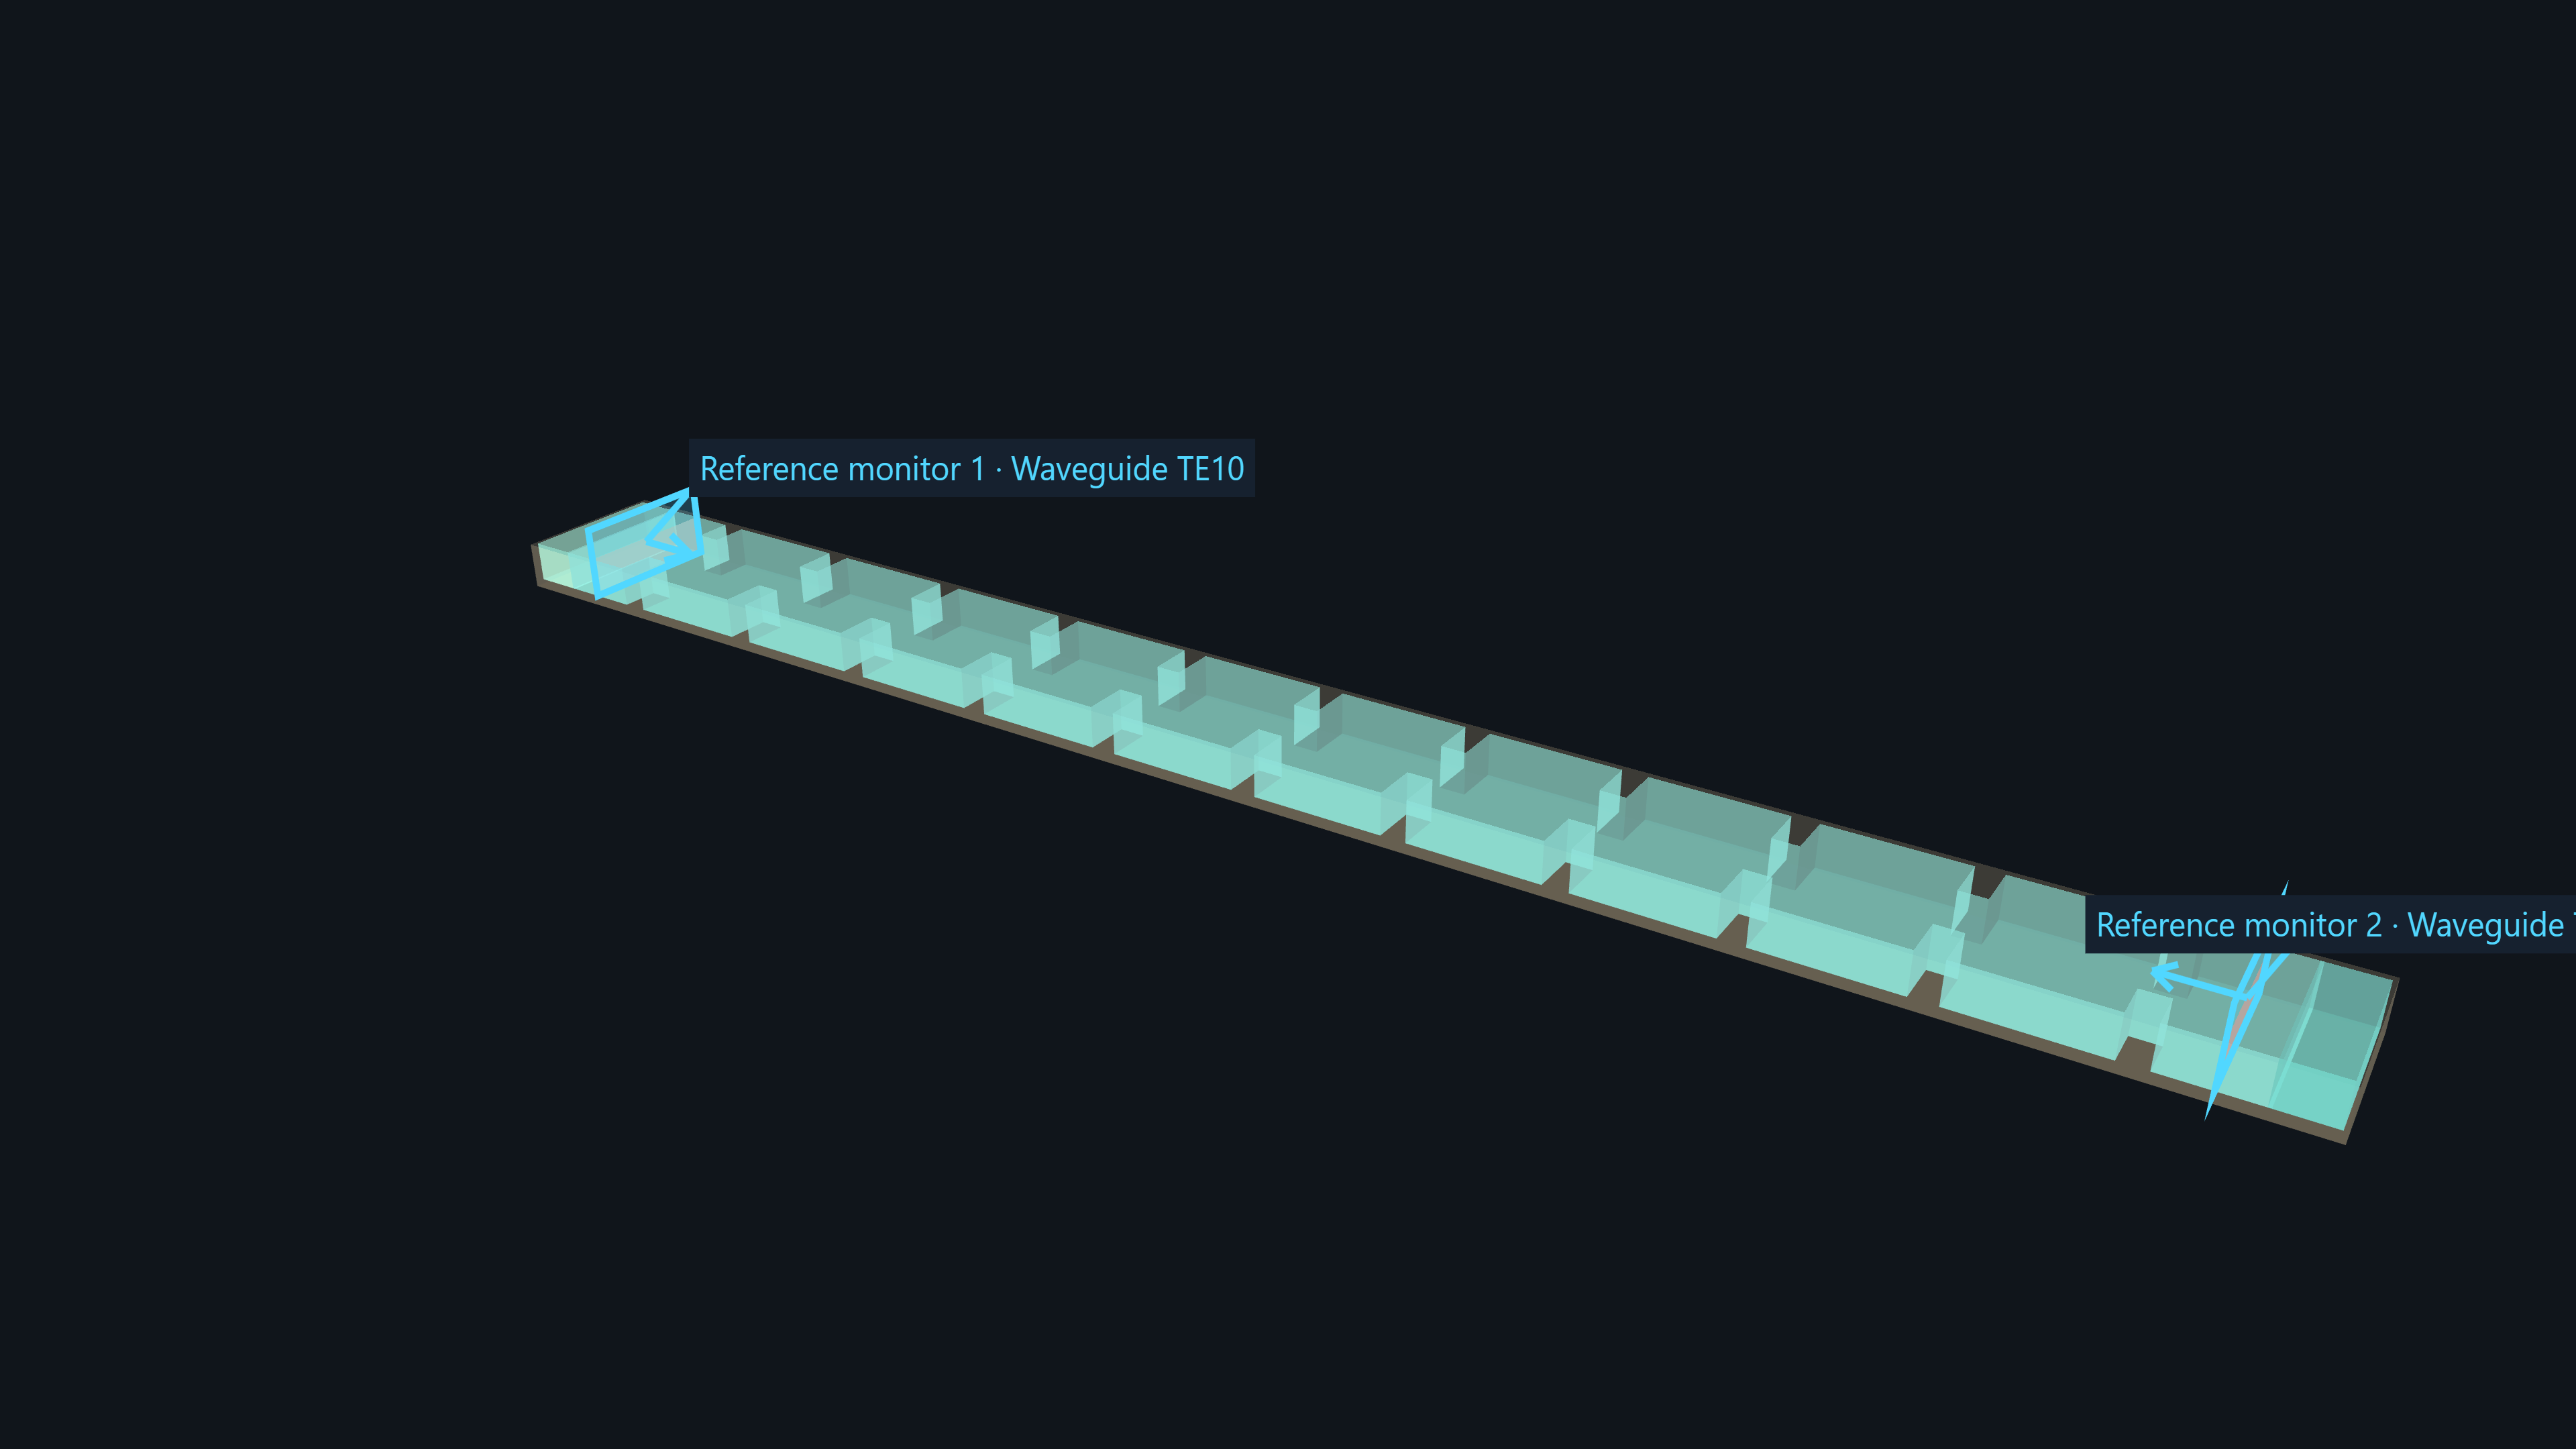
Rectangular waveguide filter · 9 GHz transparent geometry and labeled reference monitors
Device geometryLong rectangular cavity chain with repeated iris partitions and two reference monitors.
02 · RECORDED FIELDS

Recorded fields
Electromagnetic field animation through the cavity geometry. Original two-second playback is preserved. Original 24 frames at 12 fps; playback time is not simulation runtime.

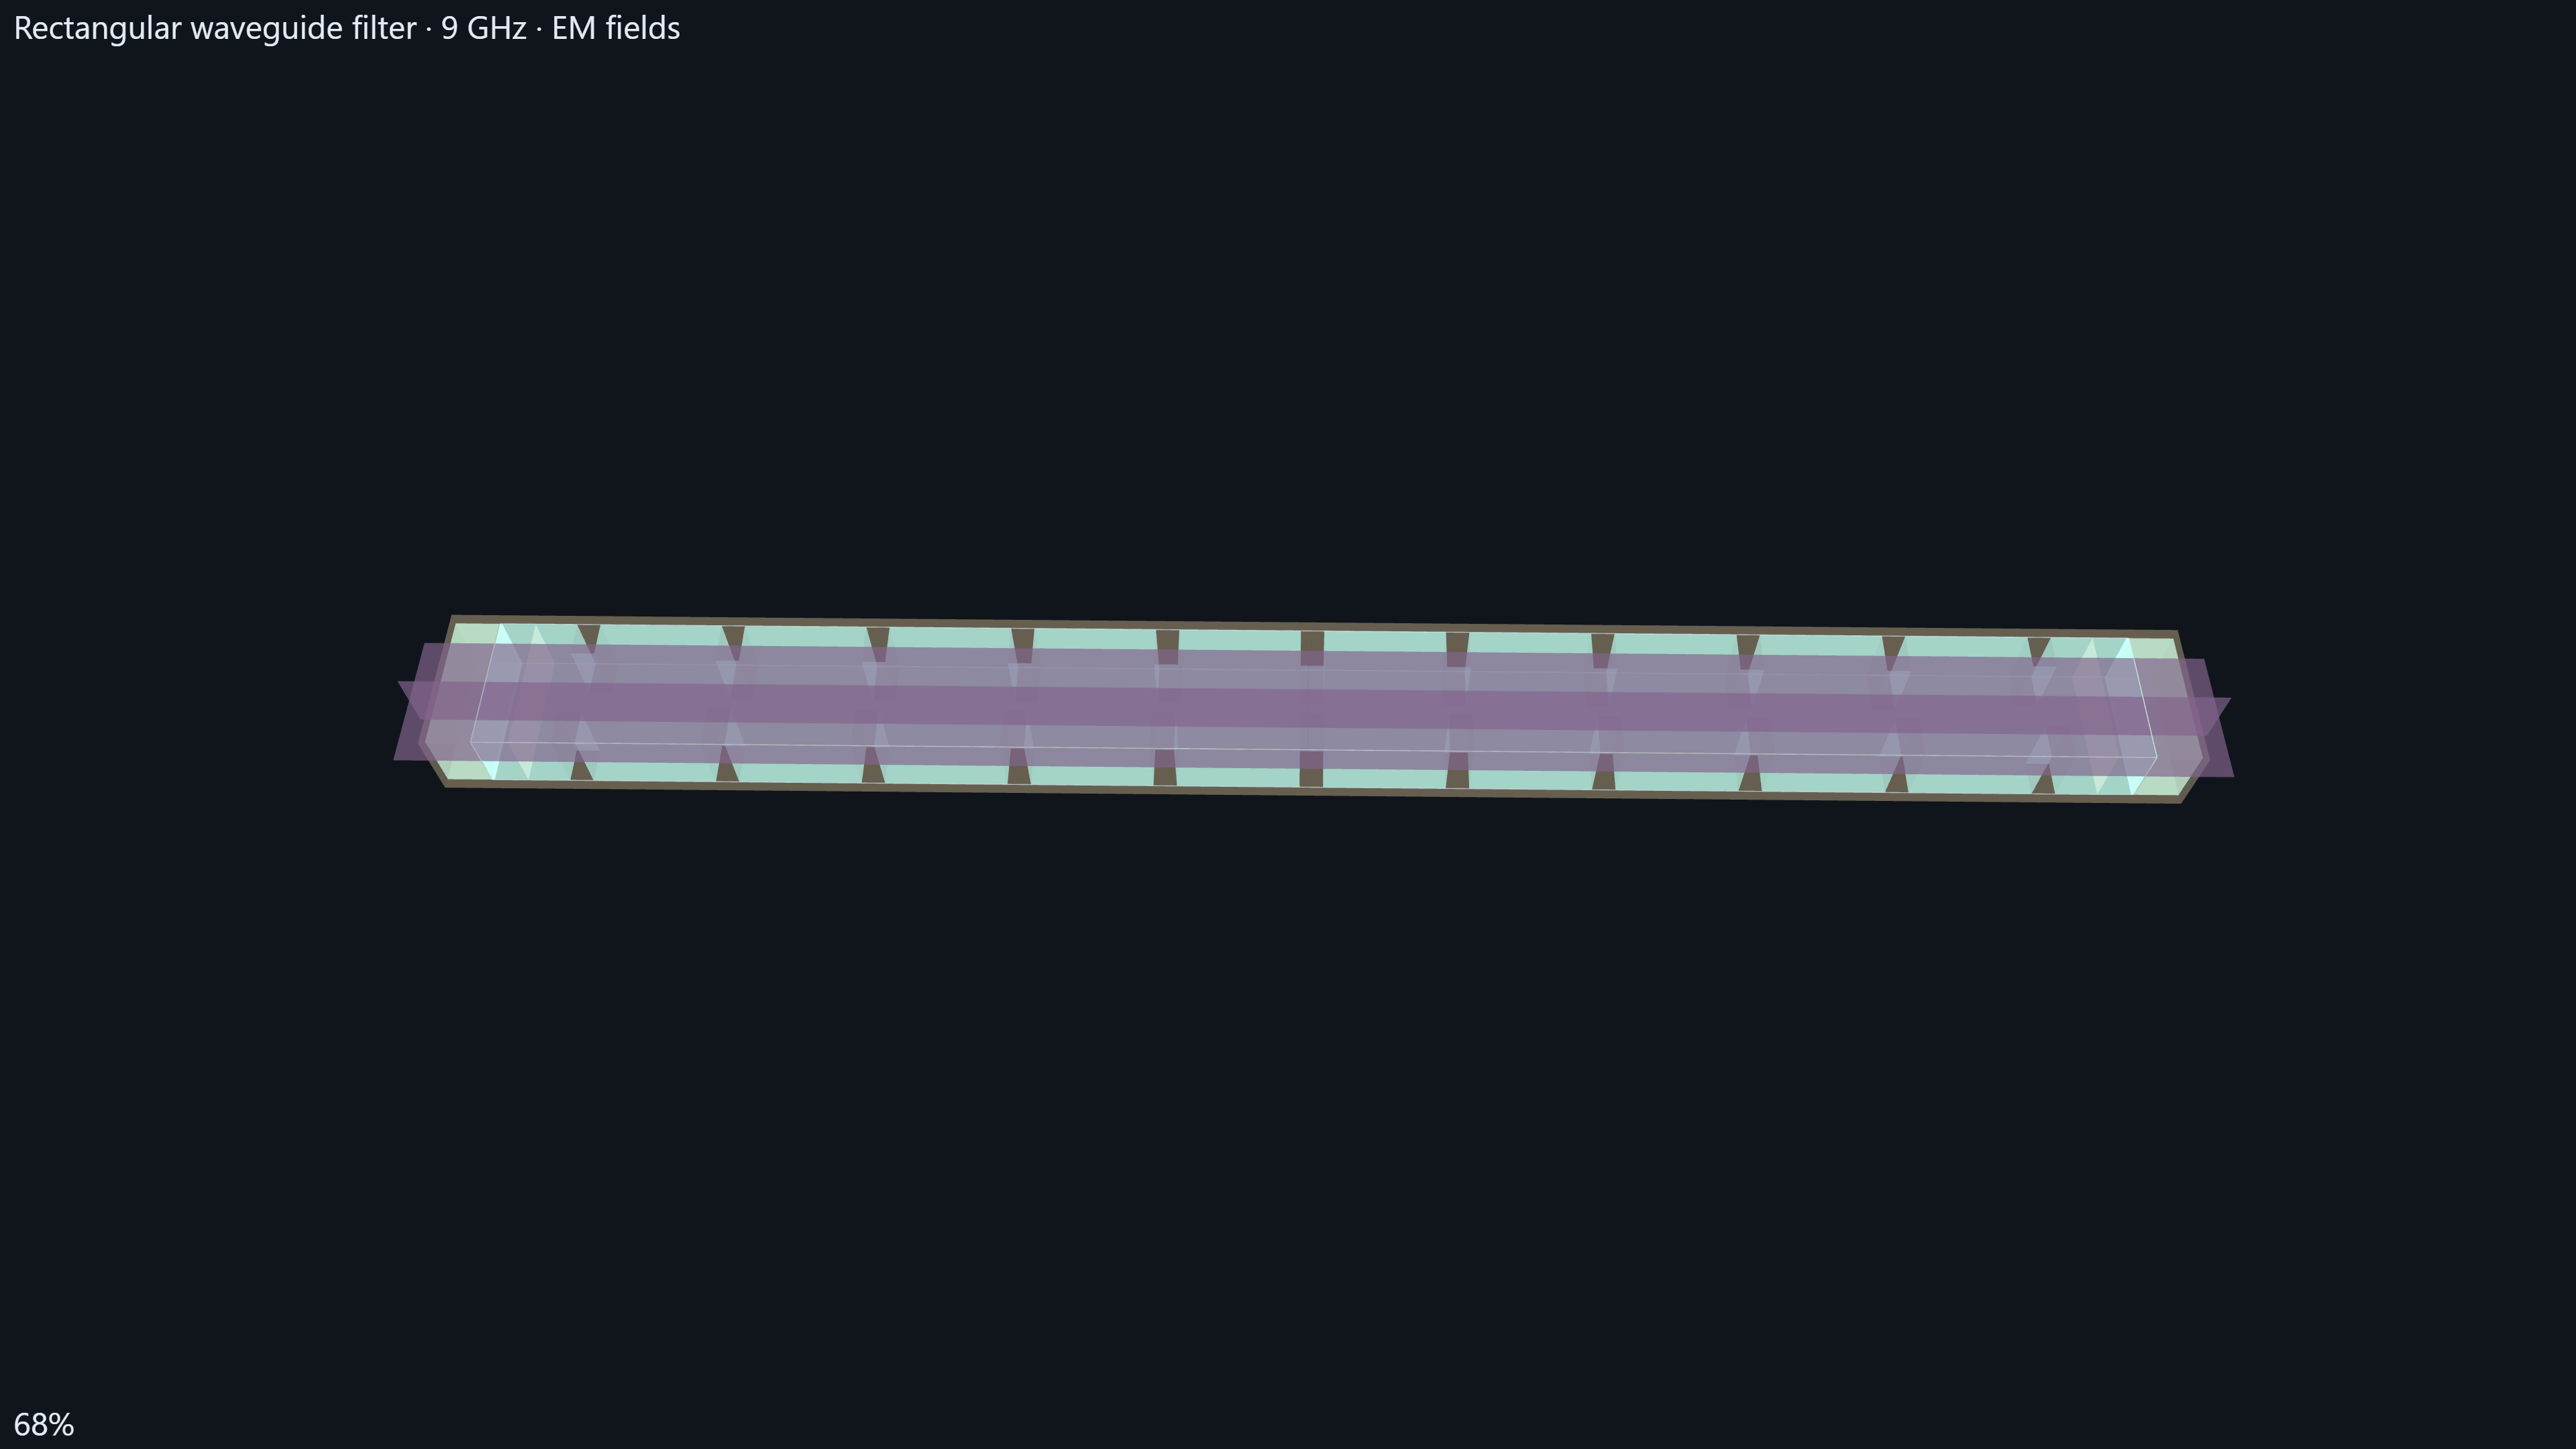
Rectangular waveguide filter · 9 GHz exported electromagnetic-field snapshot at the displayed 68% state
Recorded fieldsStatic electromagnetic-field snapshot with the original 68% overlay. The overlay does not establish a physical timestamp or accuracy metric.
03 · TIME-DOMAIN SIGNALS

Time-domain signals

Inspect the excitation and decay in the original time-domain export. Port-signal continuation estimates the remaining tail from the acquired response; it does not add FDTD time steps. How predictive continuation works
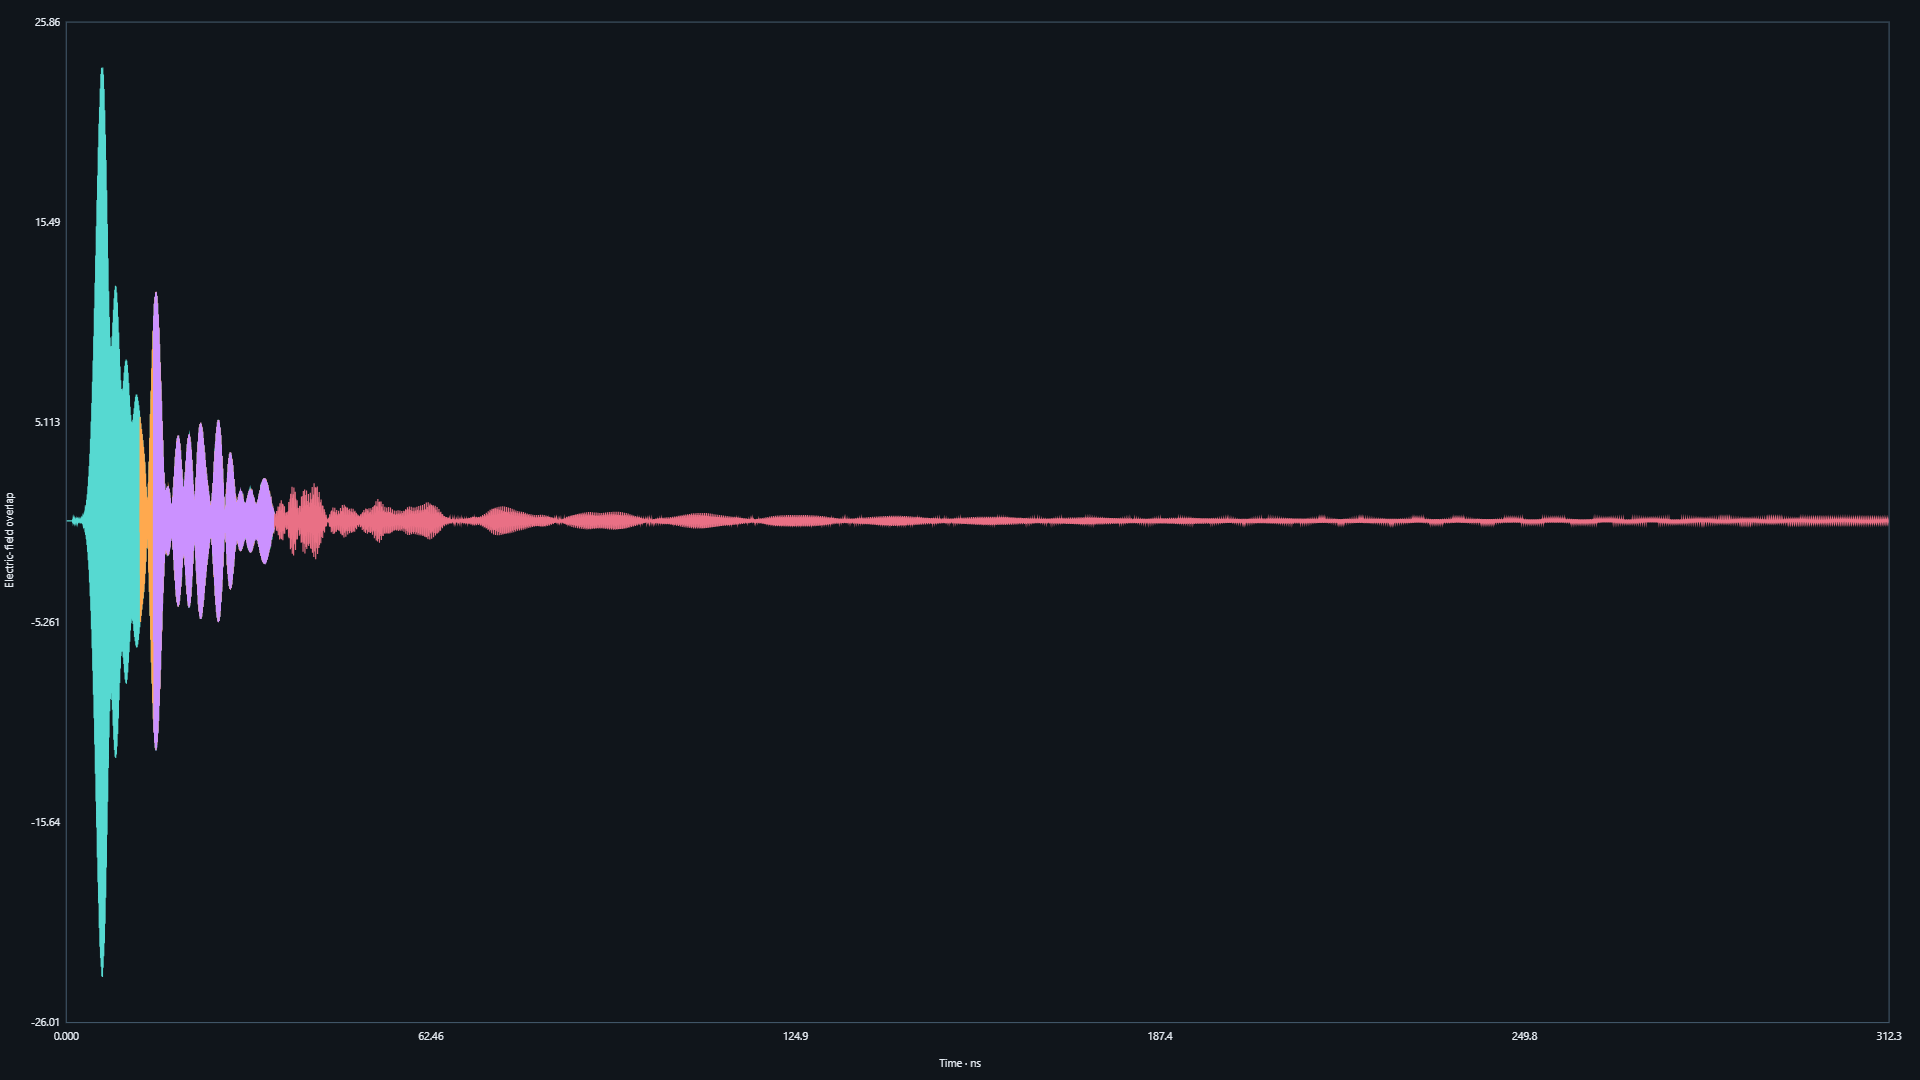
Rectangular waveguide filter · 9 GHz electric-field overlap versus time in nanoseconds
Time-domain port signalsOriginal time-domain electric-field overlap, showing the excited response and its decay. Read the time axis in nanoseconds; the continuation is estimated from the recorded port response.
04 · FREQUENCY RESPONSE

Frequency response
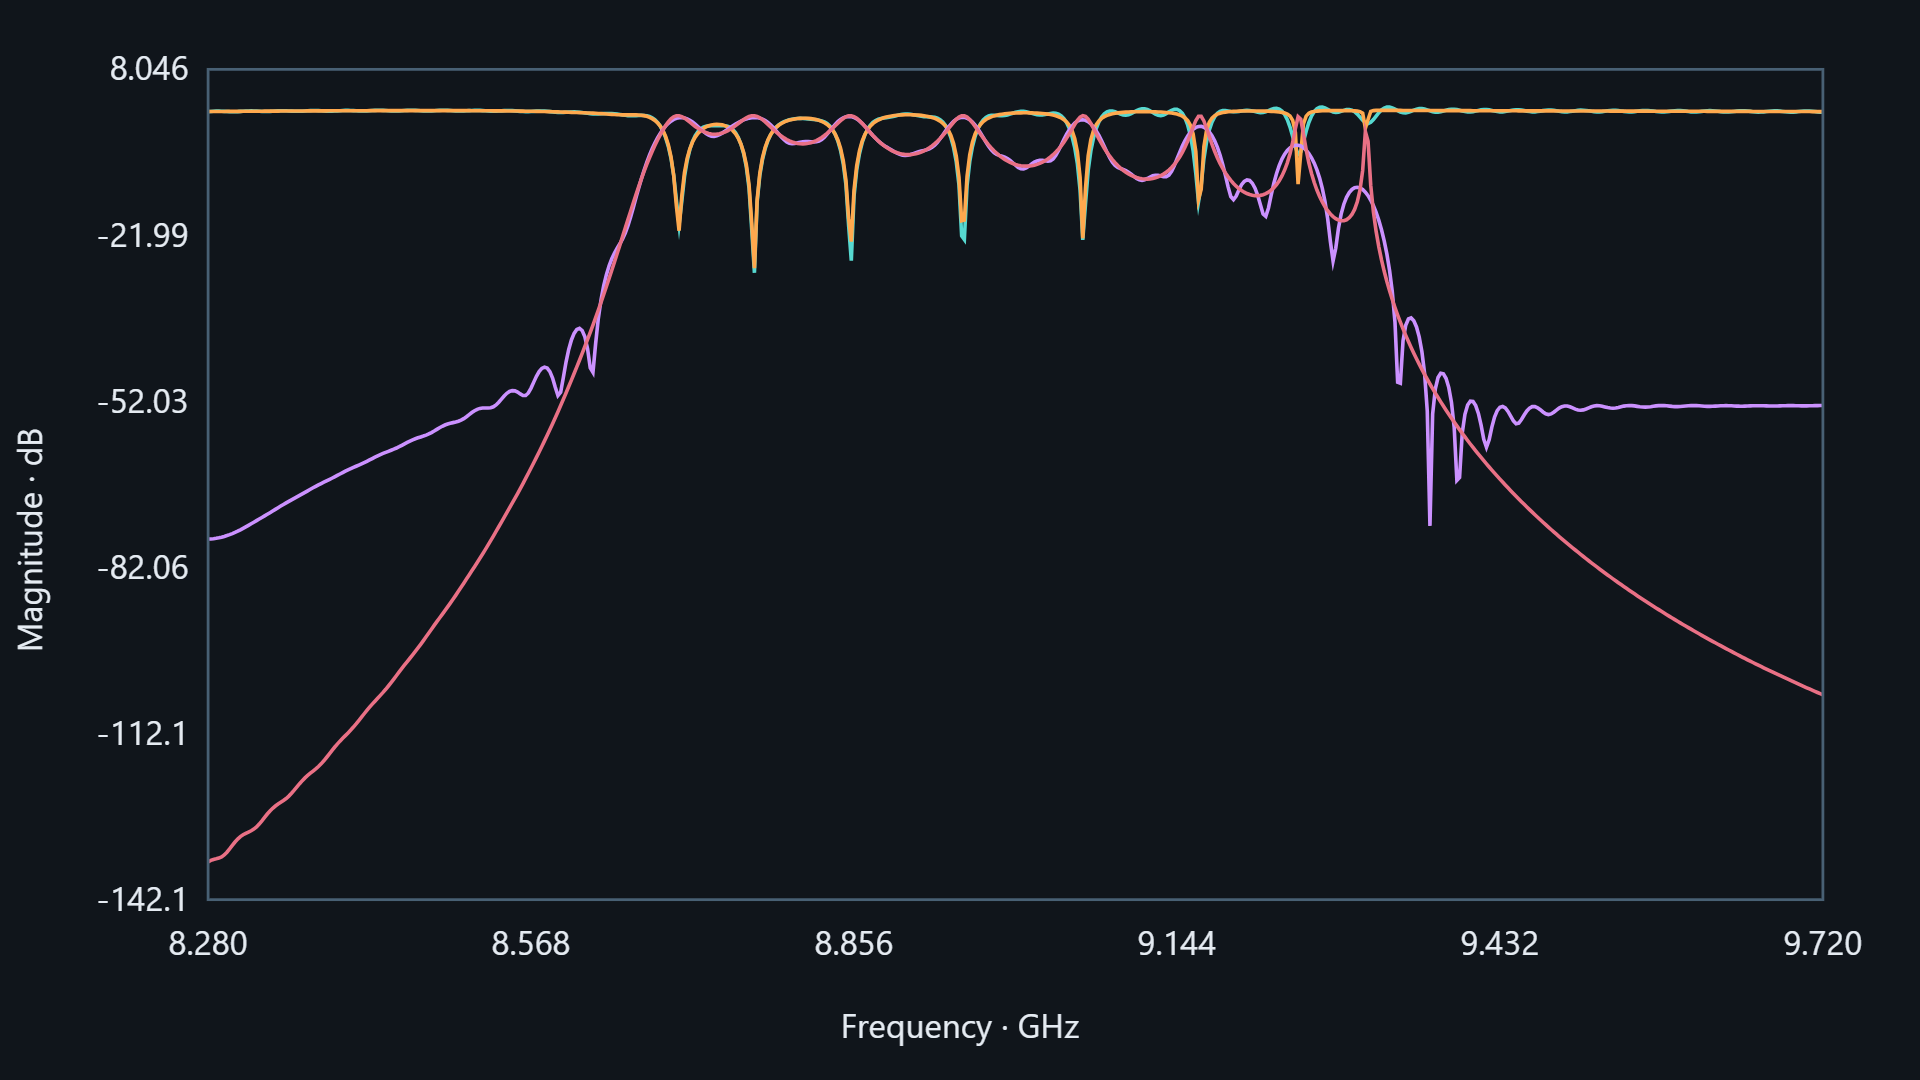
Rectangular waveguide filter · 9 GHz overlaid magnitude response versus frequency
Before and after signal estimationThe overlaid curves compare the response before and after signal estimation: the ripple-bearing trace is before estimation; the smoother trace is after estimation. The supplied axes and original trace colors are retained.
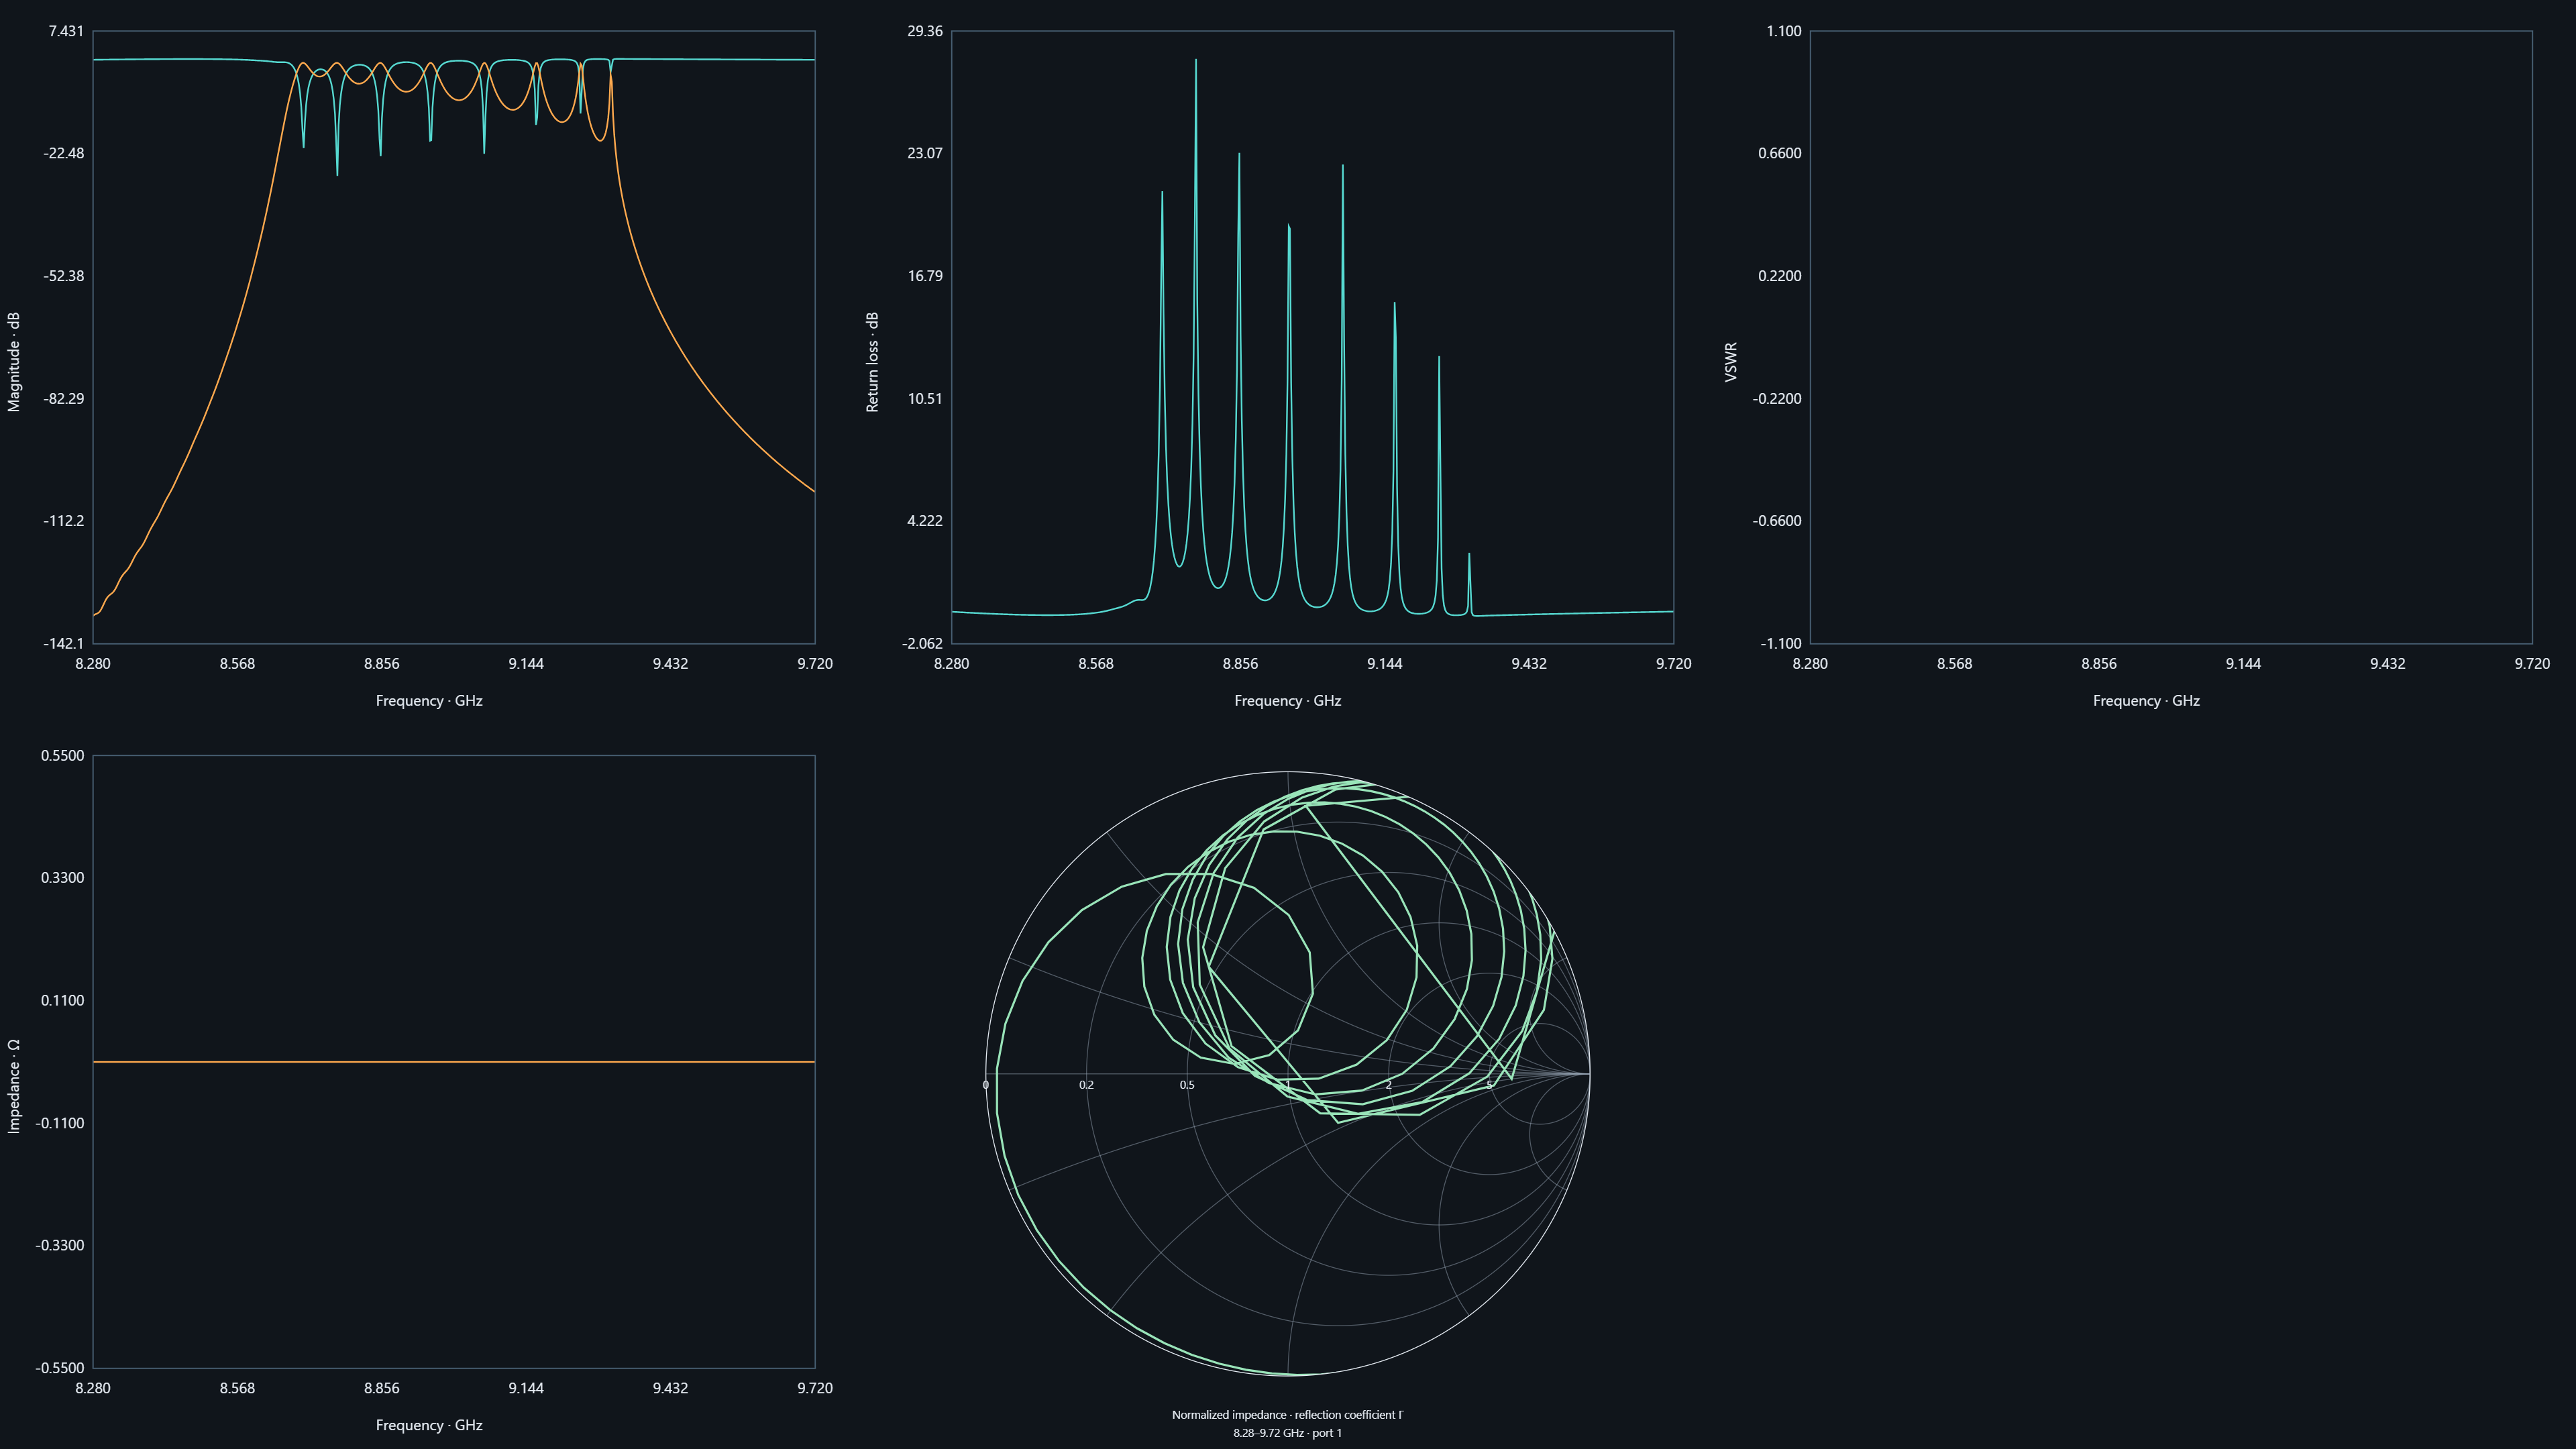
Rectangular waveguide filter · 9 GHz magnitude, return-loss, VSWR, impedance and Smith-chart dashboard
Frequency-response overviewResult dashboard across 8.28–9.72 GHz: magnitude, return loss, VSWR, impedance and a port-1 Smith chart. Some derived panels are empty or flat in the export.
05 · TEMPERATURE DISTRIBUTION

Temperature distribution

Spatial temperature results use the recorded electromagnetic load and thermal model. They are separate from port-signal prediction; compare numerical temperature scales rather than colors alone.
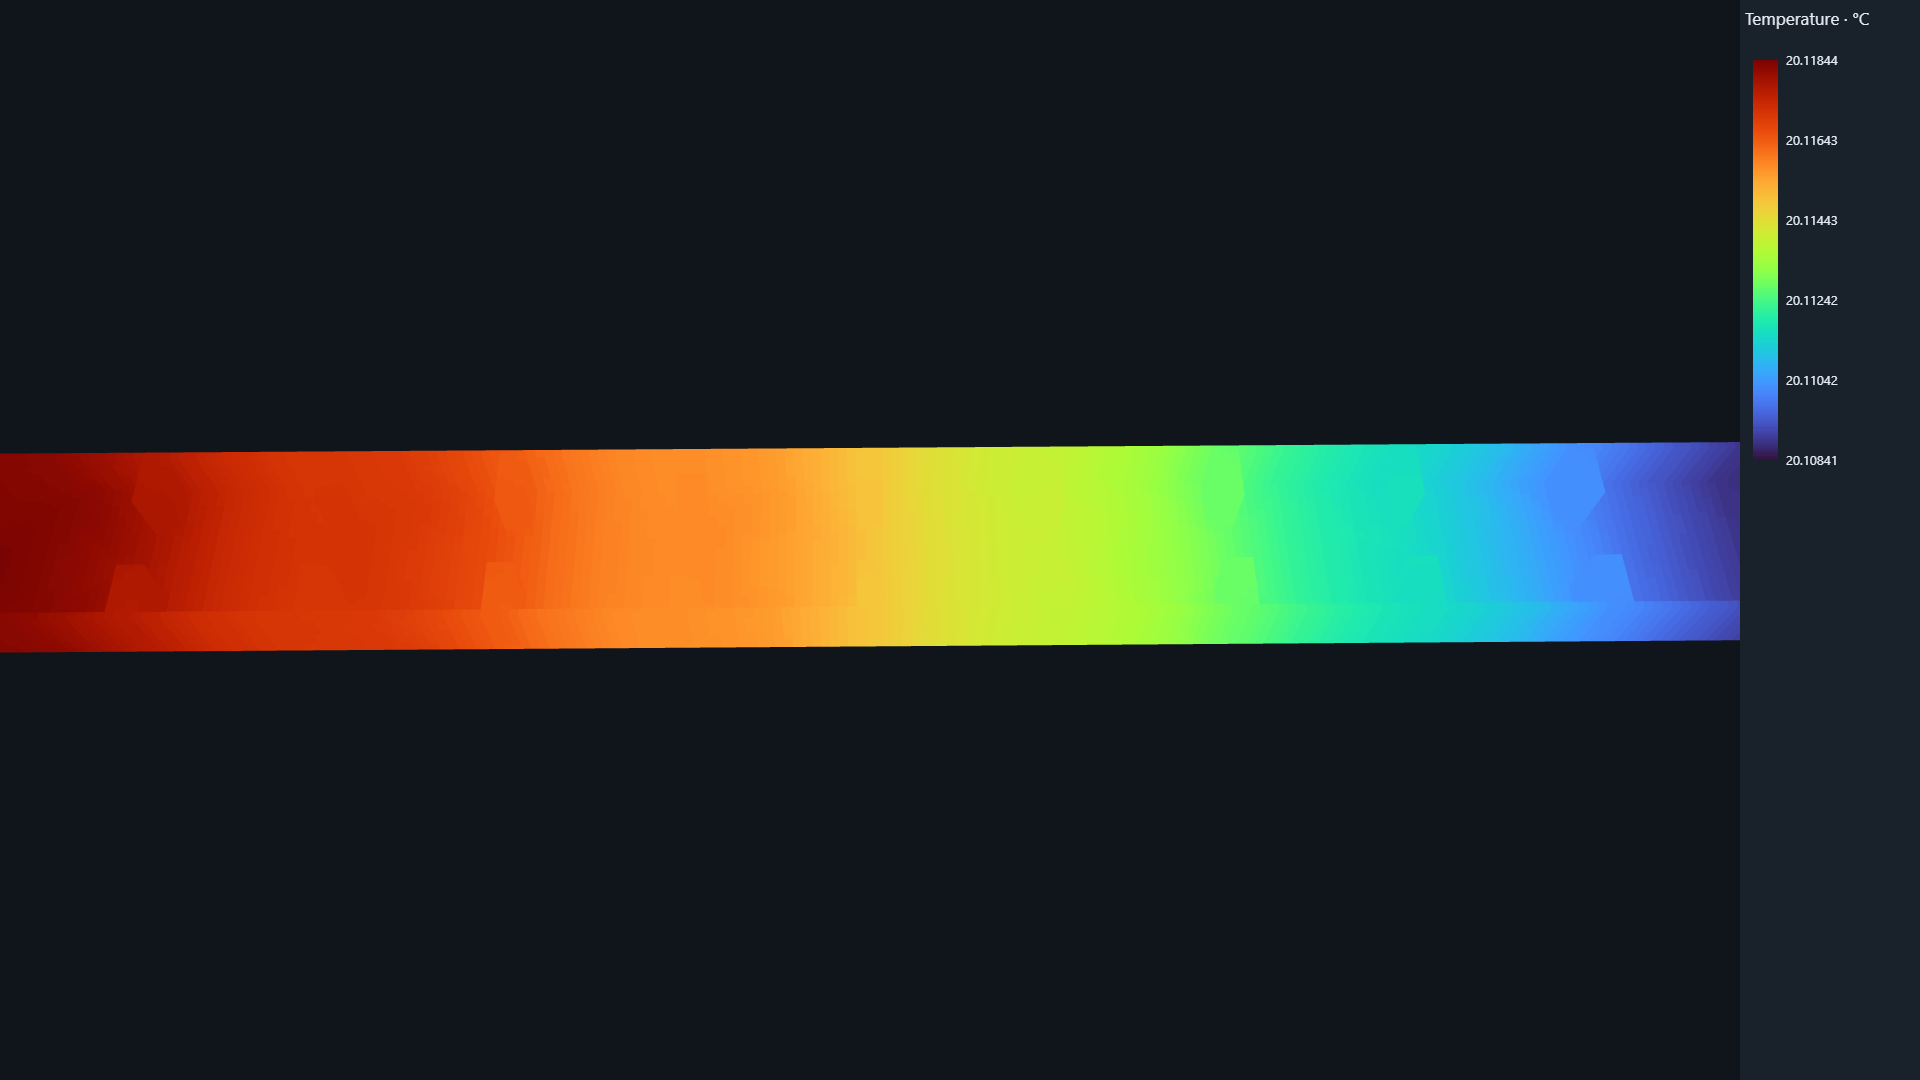
Rectangular waveguide filter · 9 GHz three-dimensional temperature map with Celsius color scale
Temperature distributionExported temperature map with its original Celsius scale. Read the numeric scale before comparing the visible color contrast.
Result interpretation

Images preserve their original pixels, axes and color scales. Videos preserve source resolution and frame timing. These are recorded exports, not a live solver.

Prediction quality requires checks against longer or withheld recorded data. A smoother curve alone does not establish accuracy or convergence.

Back to Microwave examples