Recorded EM-field slices show excitation spreading through the coupled resonators, followed by a changing stored-field pattern. Original 24 frames at 12 fps; playback time is not simulation runtime.
MICROWAVE FDTD STUDIO · APPLICATION EXAMPLE
6th-order coaxial filter · two transmission zeros
Explore the device model, recorded field evolution and original response exports in Microwave FDTD Studio.
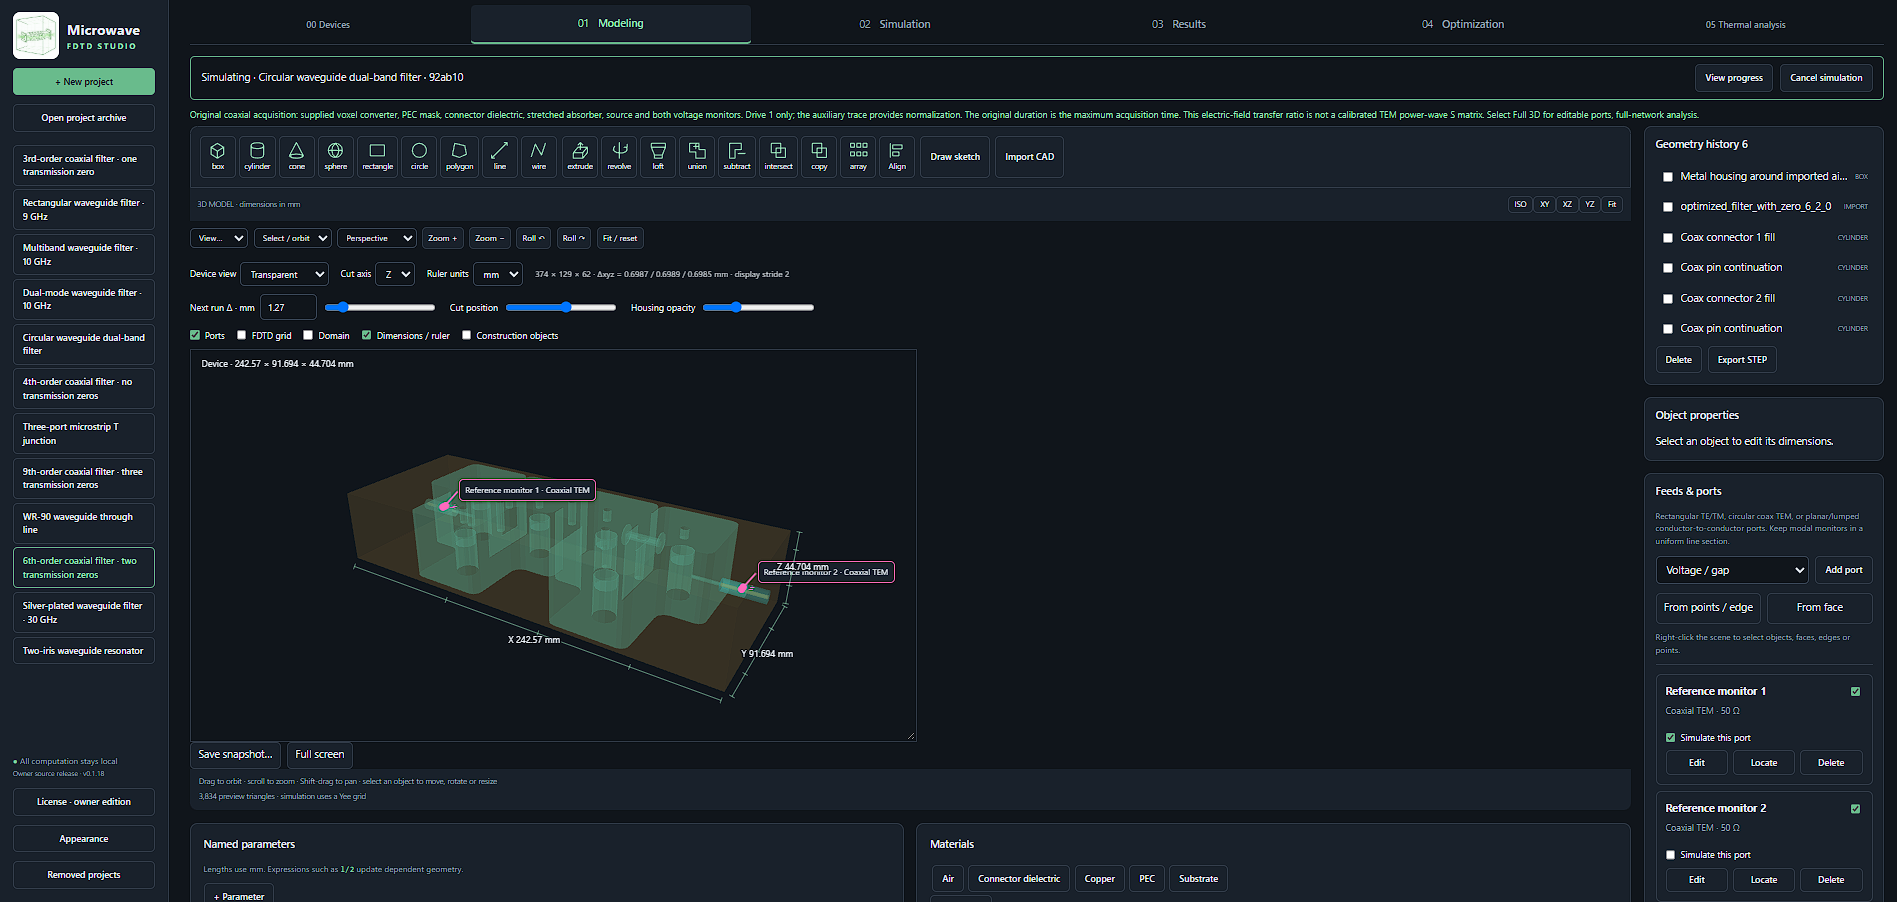
01 · MODEL & PORTS
Model & ports
02 · RECORDED FIELDS
Recorded fields
03 · TIME-DOMAIN SIGNALS
Time-domain signals
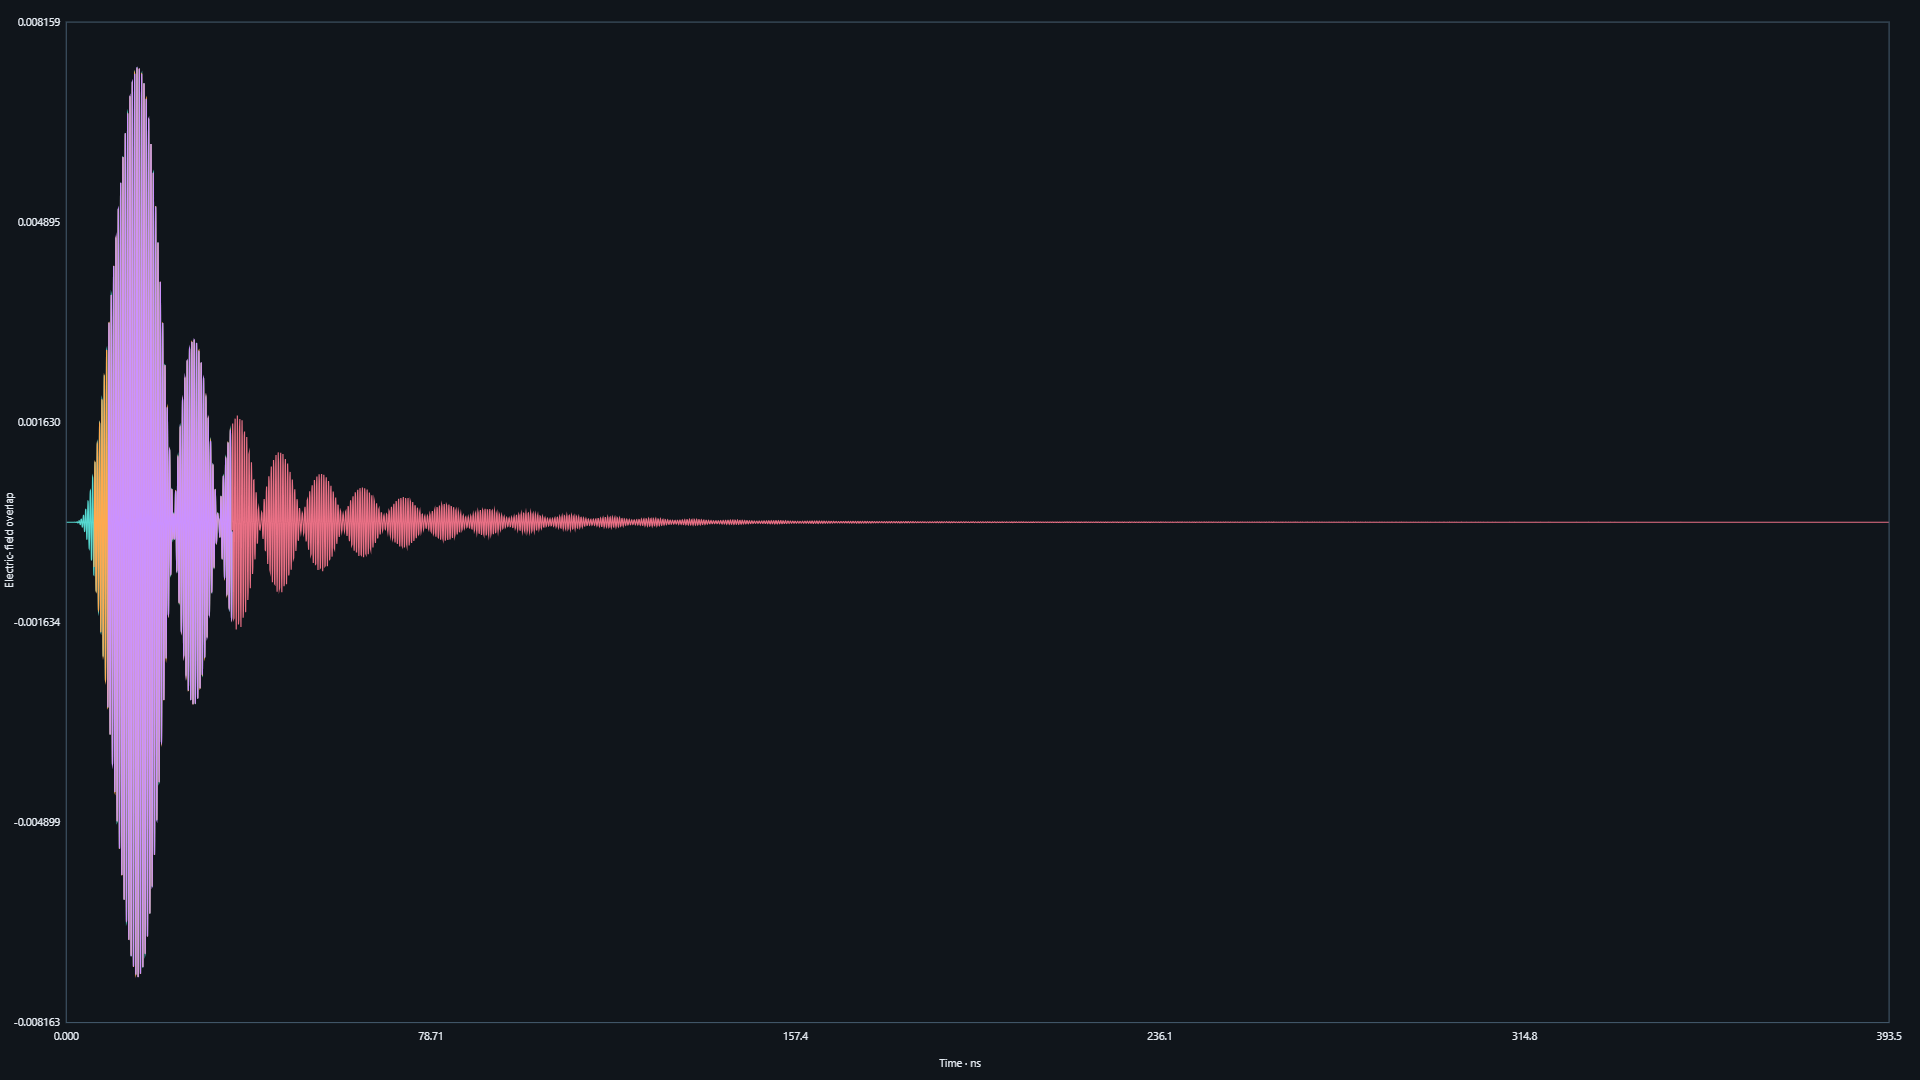
Inspect the excitation and decay in the original time-domain export. Port-signal continuation estimates the remaining tail from the acquired response; it does not add FDTD time steps. How predictive continuation works
04 · FREQUENCY RESPONSE
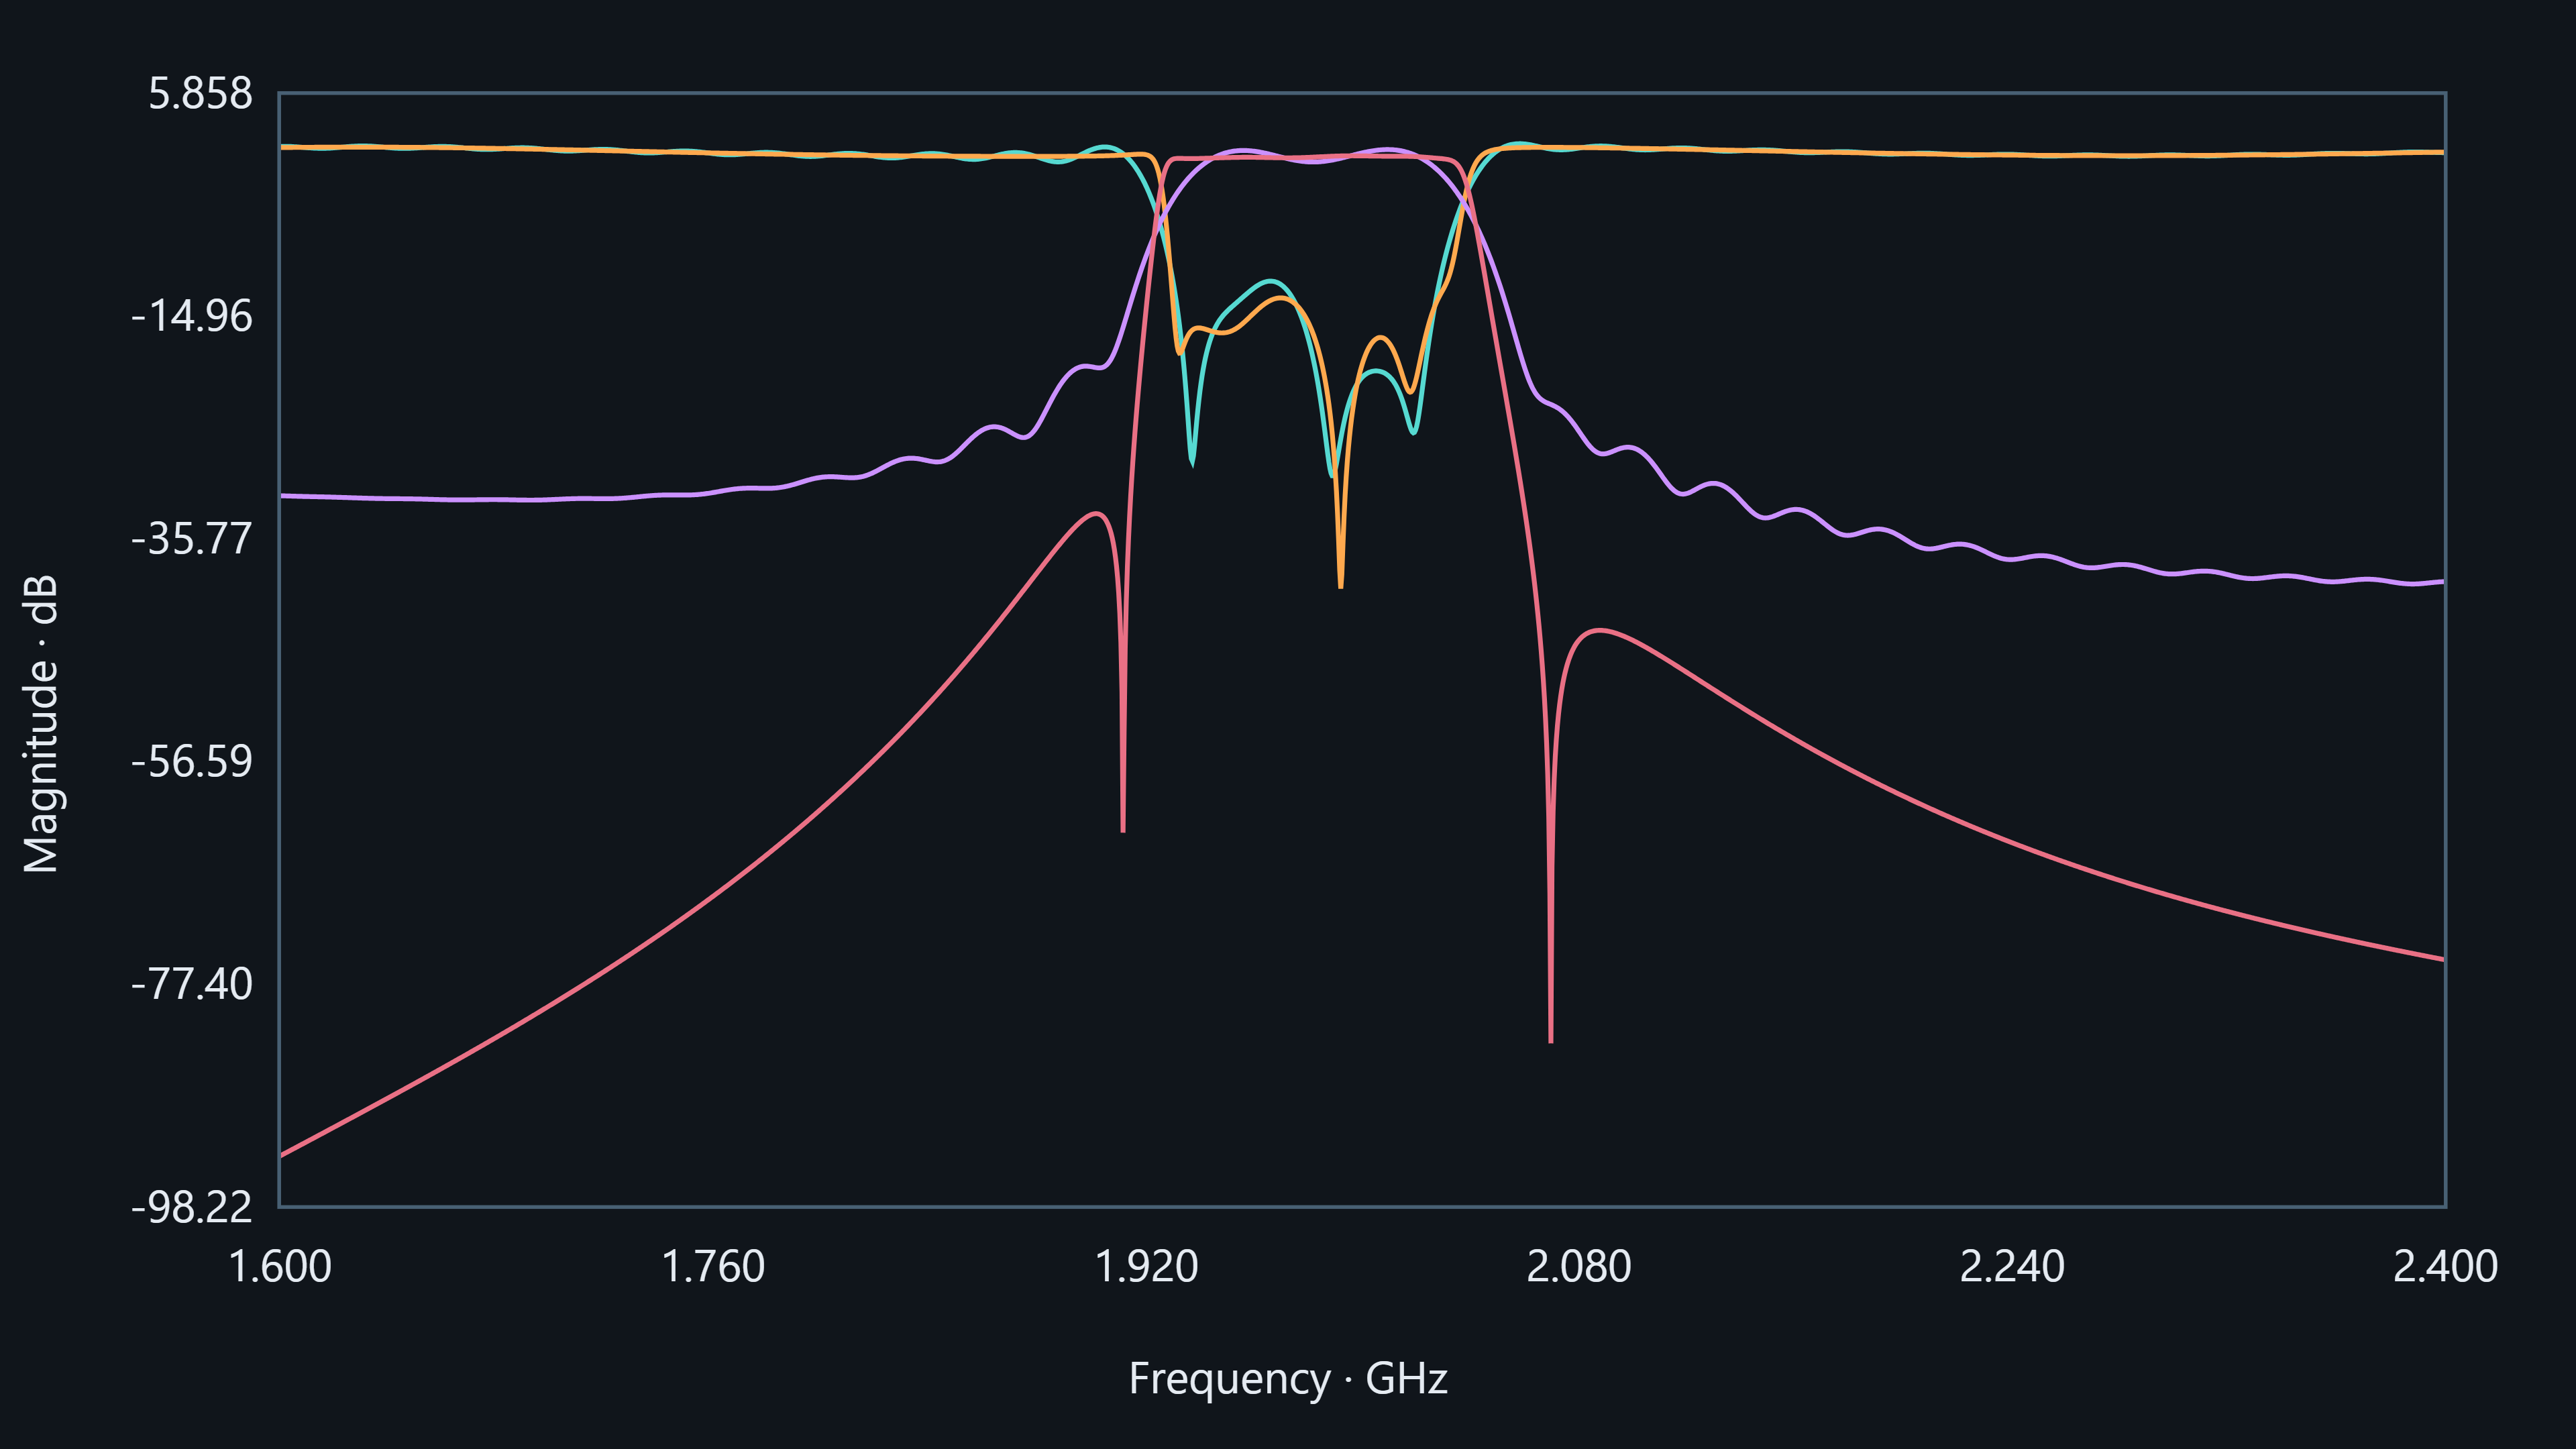
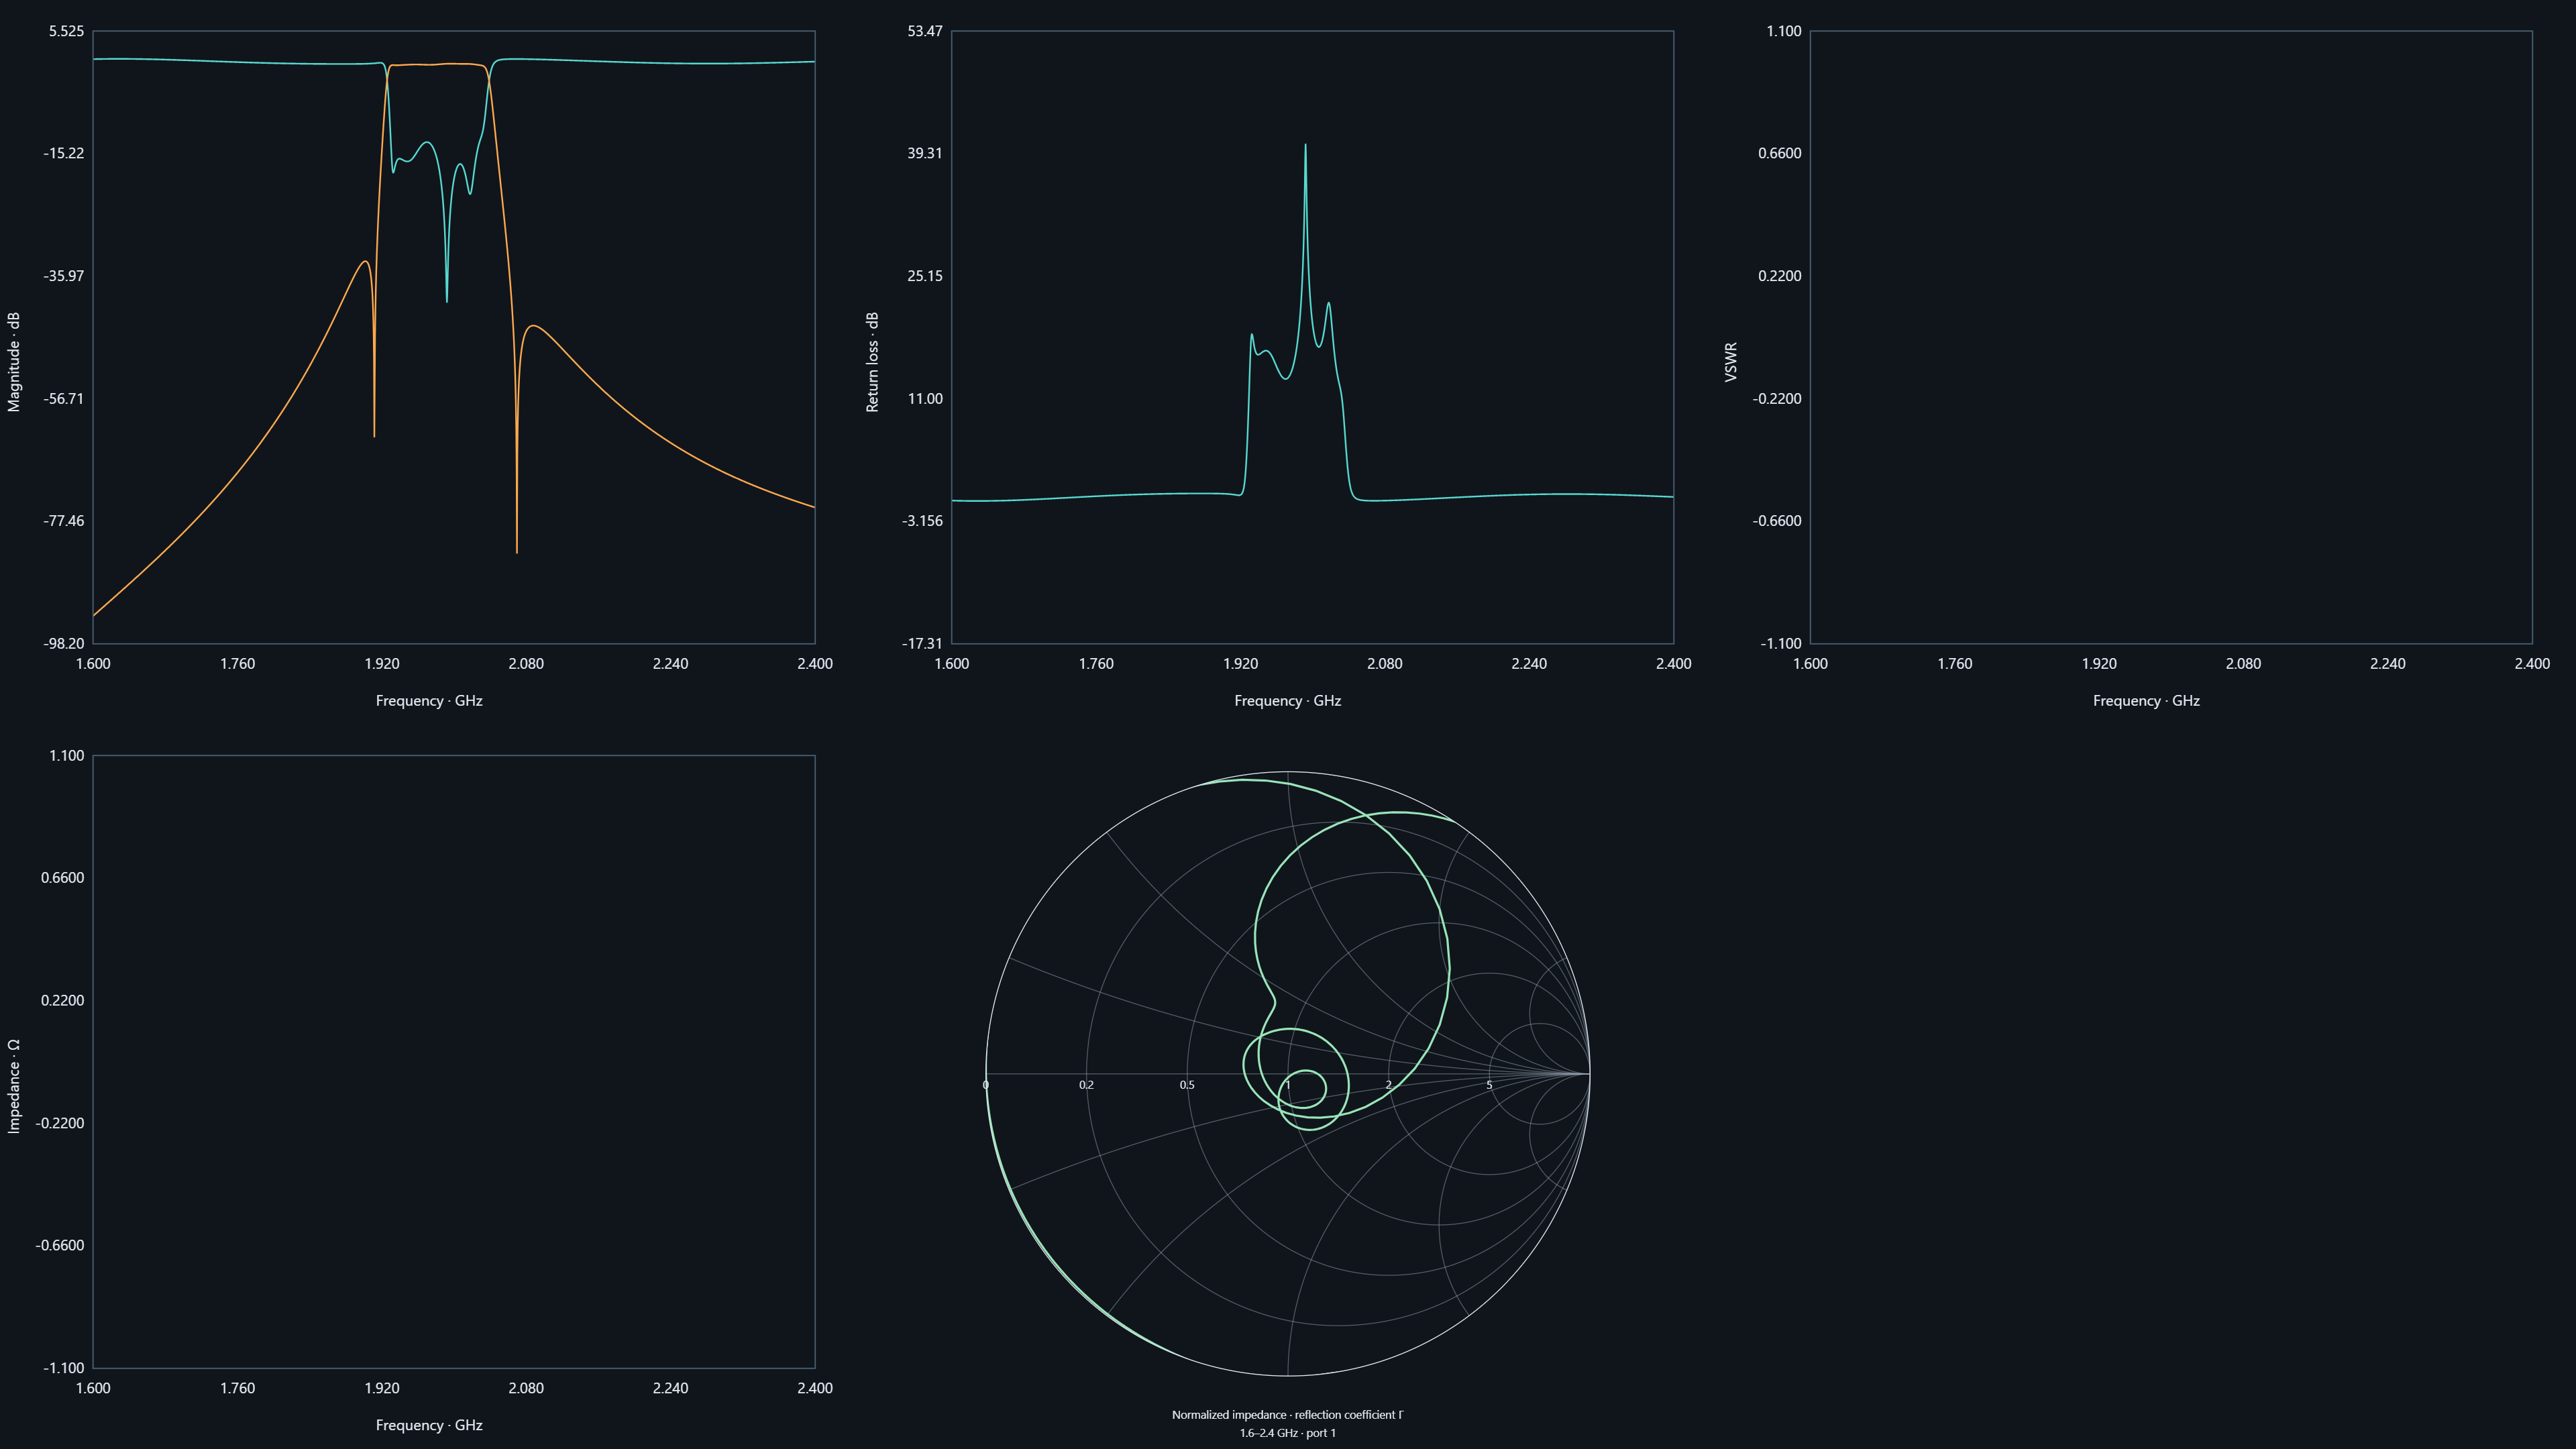
Frequency response
05 · TEMPERATURE DISTRIBUTION
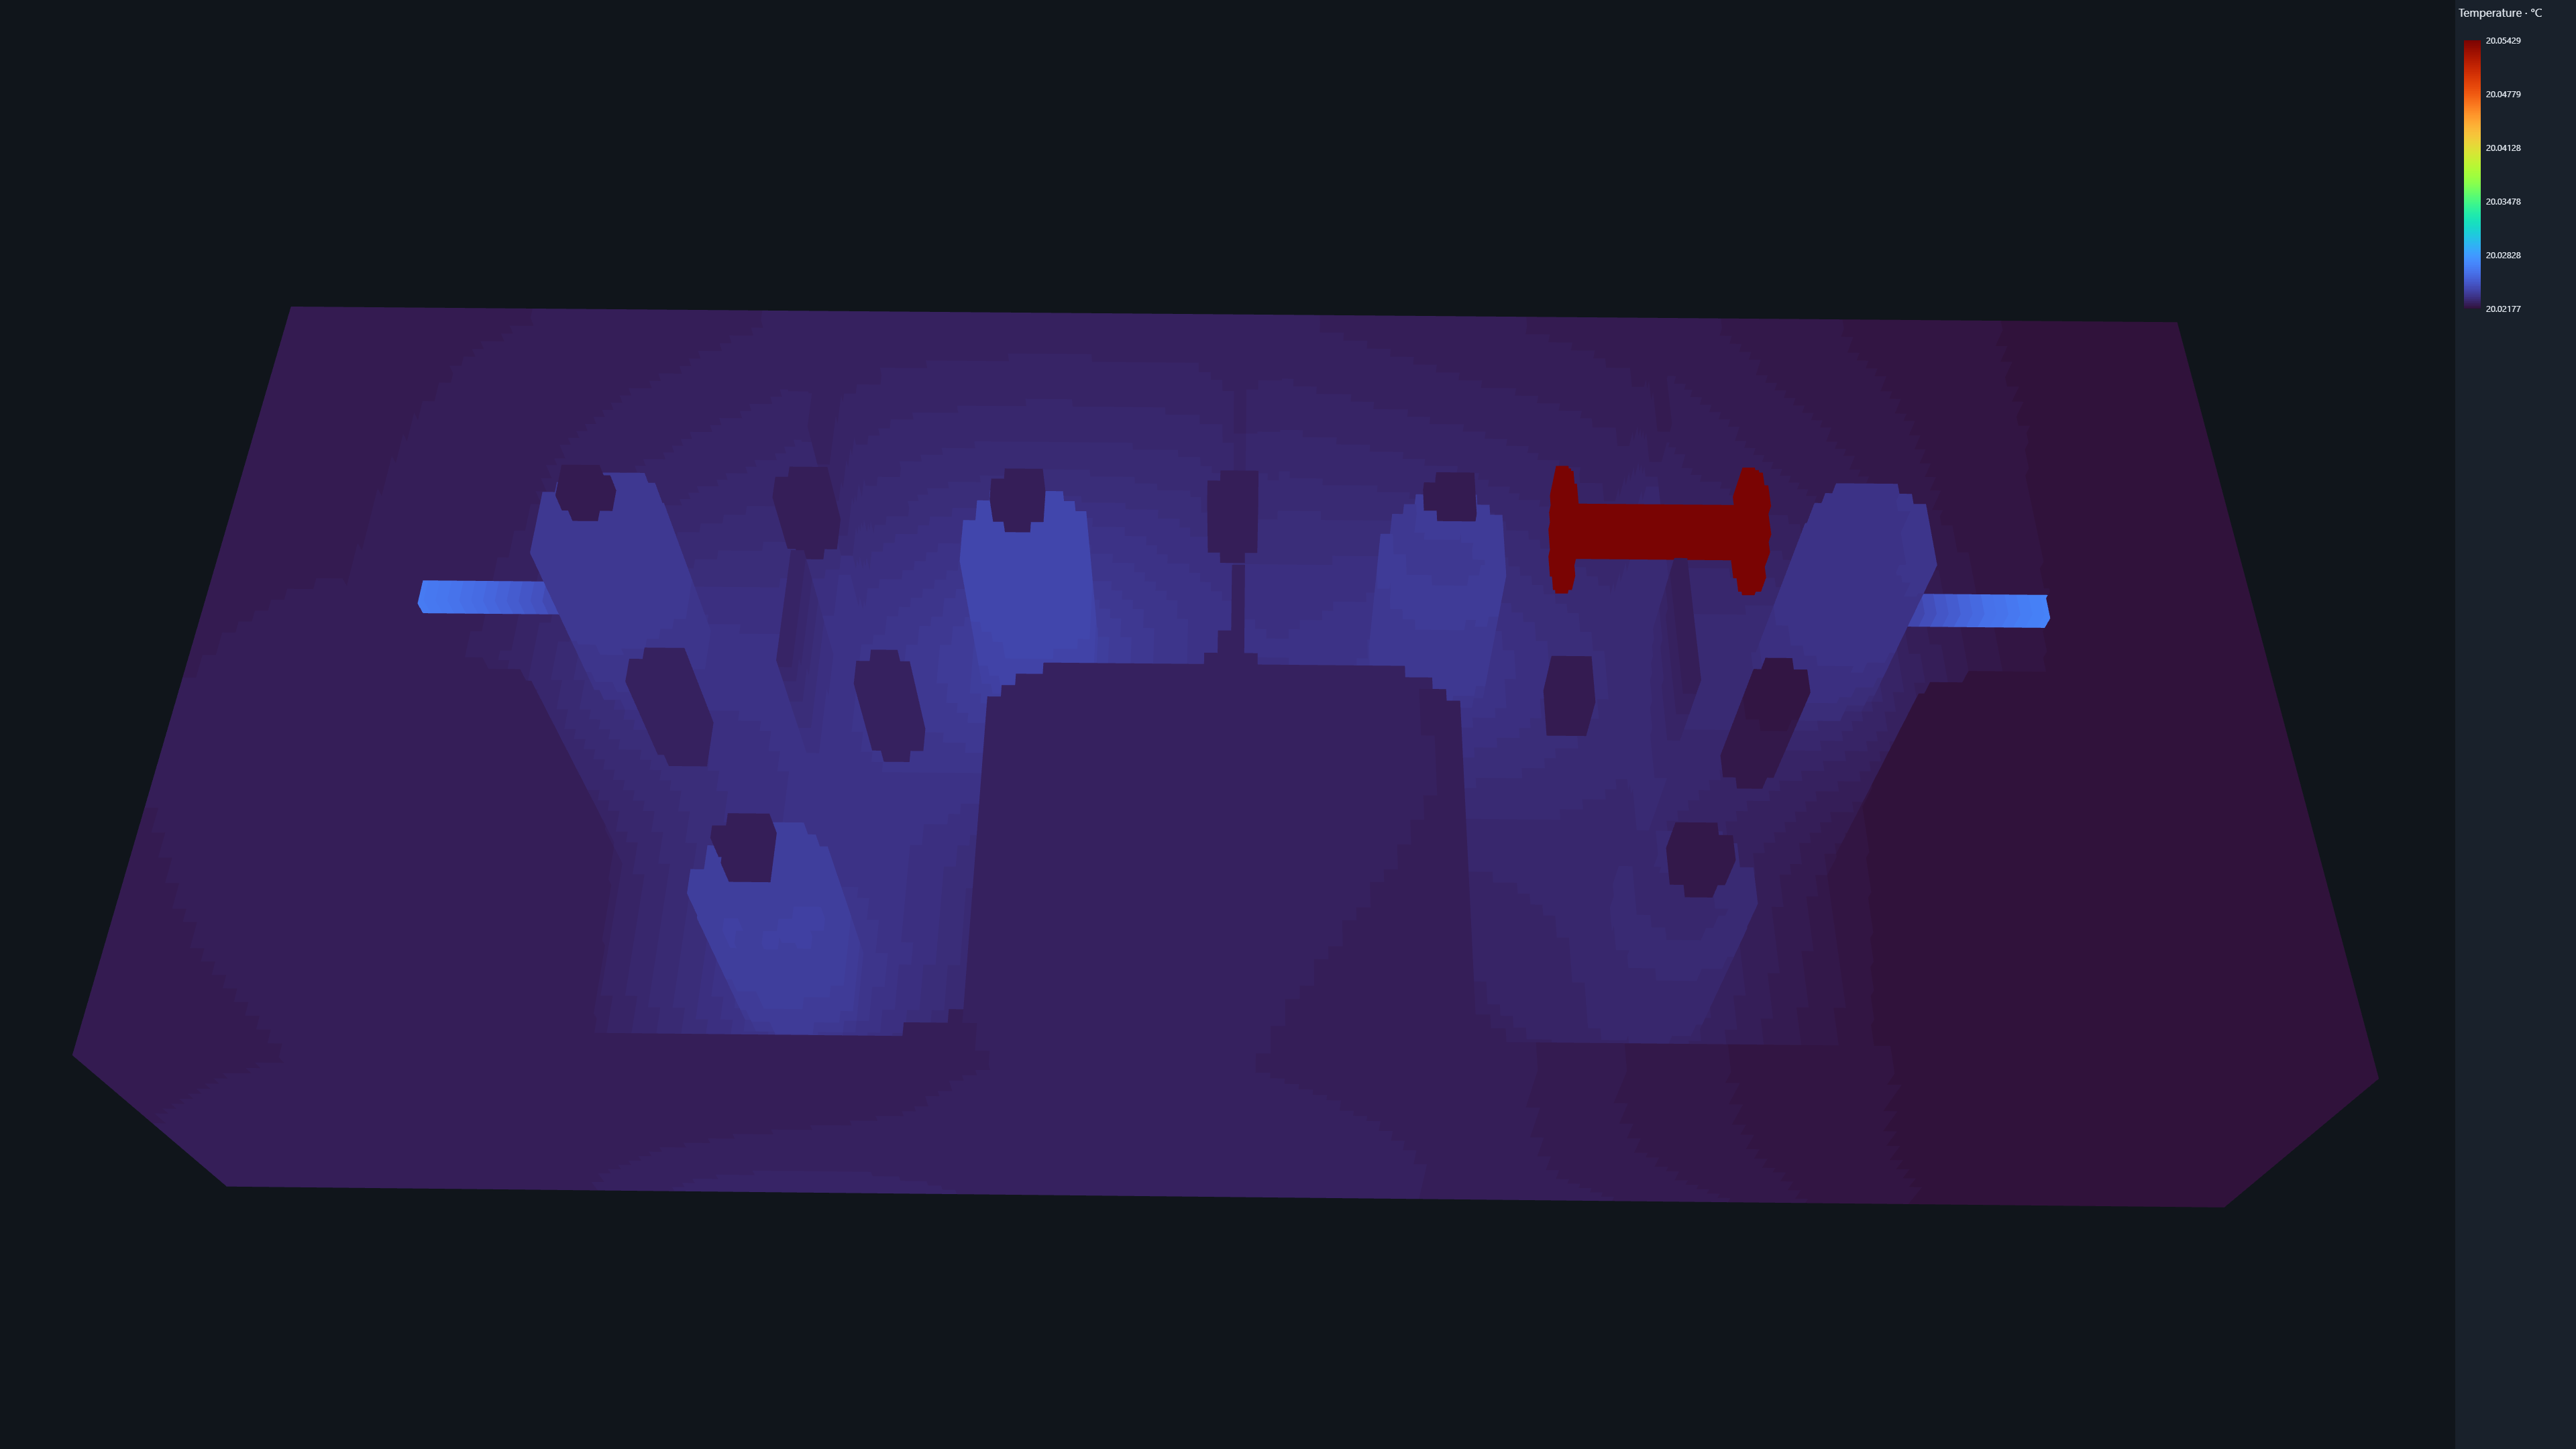
Temperature distribution
Spatial temperature results use the recorded electromagnetic load and thermal model. They are separate from port-signal prediction; compare numerical temperature scales rather than colors alone.
Result interpretation
Images preserve their original pixels, axes and color scales. Videos preserve source resolution and frame timing. These are recorded exports, not a live solver. The supplied acquisition uses auxiliary-normalized electric-field transfer ratios; these should not be read as a calibrated TEM power-wave S matrix.
Prediction quality requires checks against longer or withheld recorded data. A smoother curve alone does not establish accuracy or convergence.