← All Antenna examples
ANTENNA FDTD STUDIO · APPLICATION EXAMPLE

Intelligent Reflecting Surfaces

A horn-fed reflecting array, from element-phase synthesis to its modeled geometry and exported plots. Explore the supplied Intelligent reflecting arrays example in Antenna FDTD Studio.

01 · SYNTHESIS & MODEL

From phase map to array geometry.
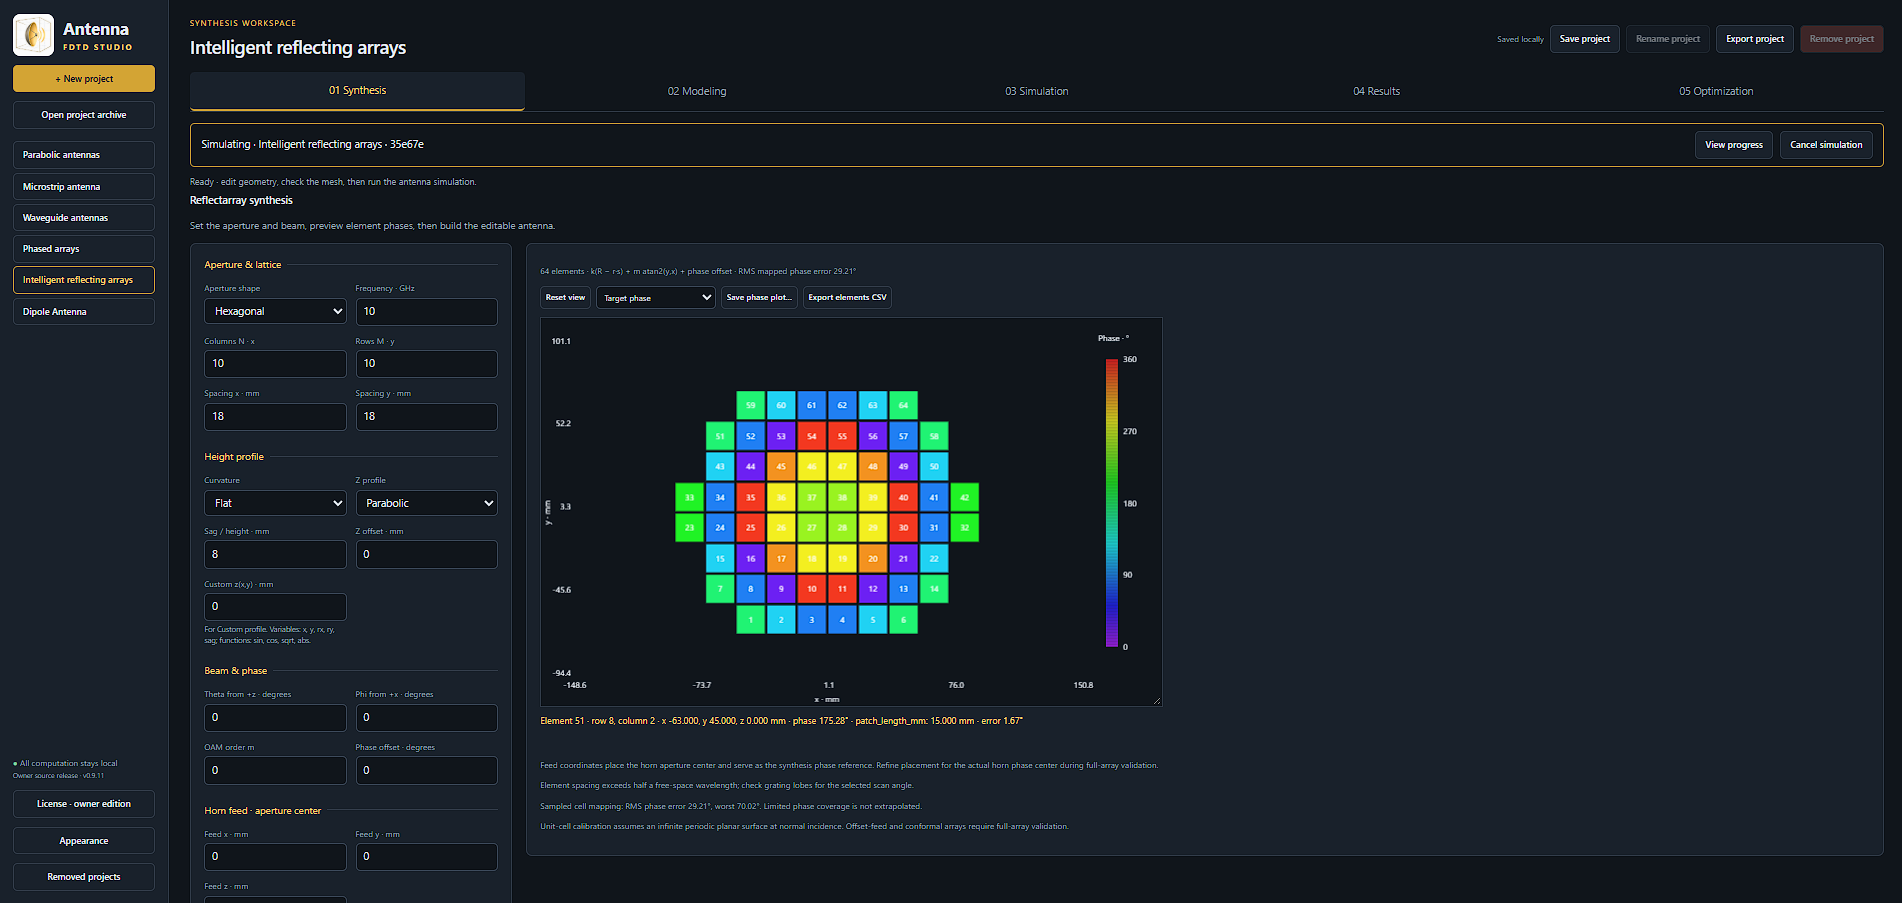
The supplied synthesis workspace shows a hexagonal 64-element target-phase map, with 10 GHz frequency and 18 mm spacing along both lattice axes.
Reflectarray synthesis workspaceThe supplied synthesis workspace shows a hexagonal 64-element target-phase map, with 10 GHz frequency and 18 mm spacing along both lattice axes.
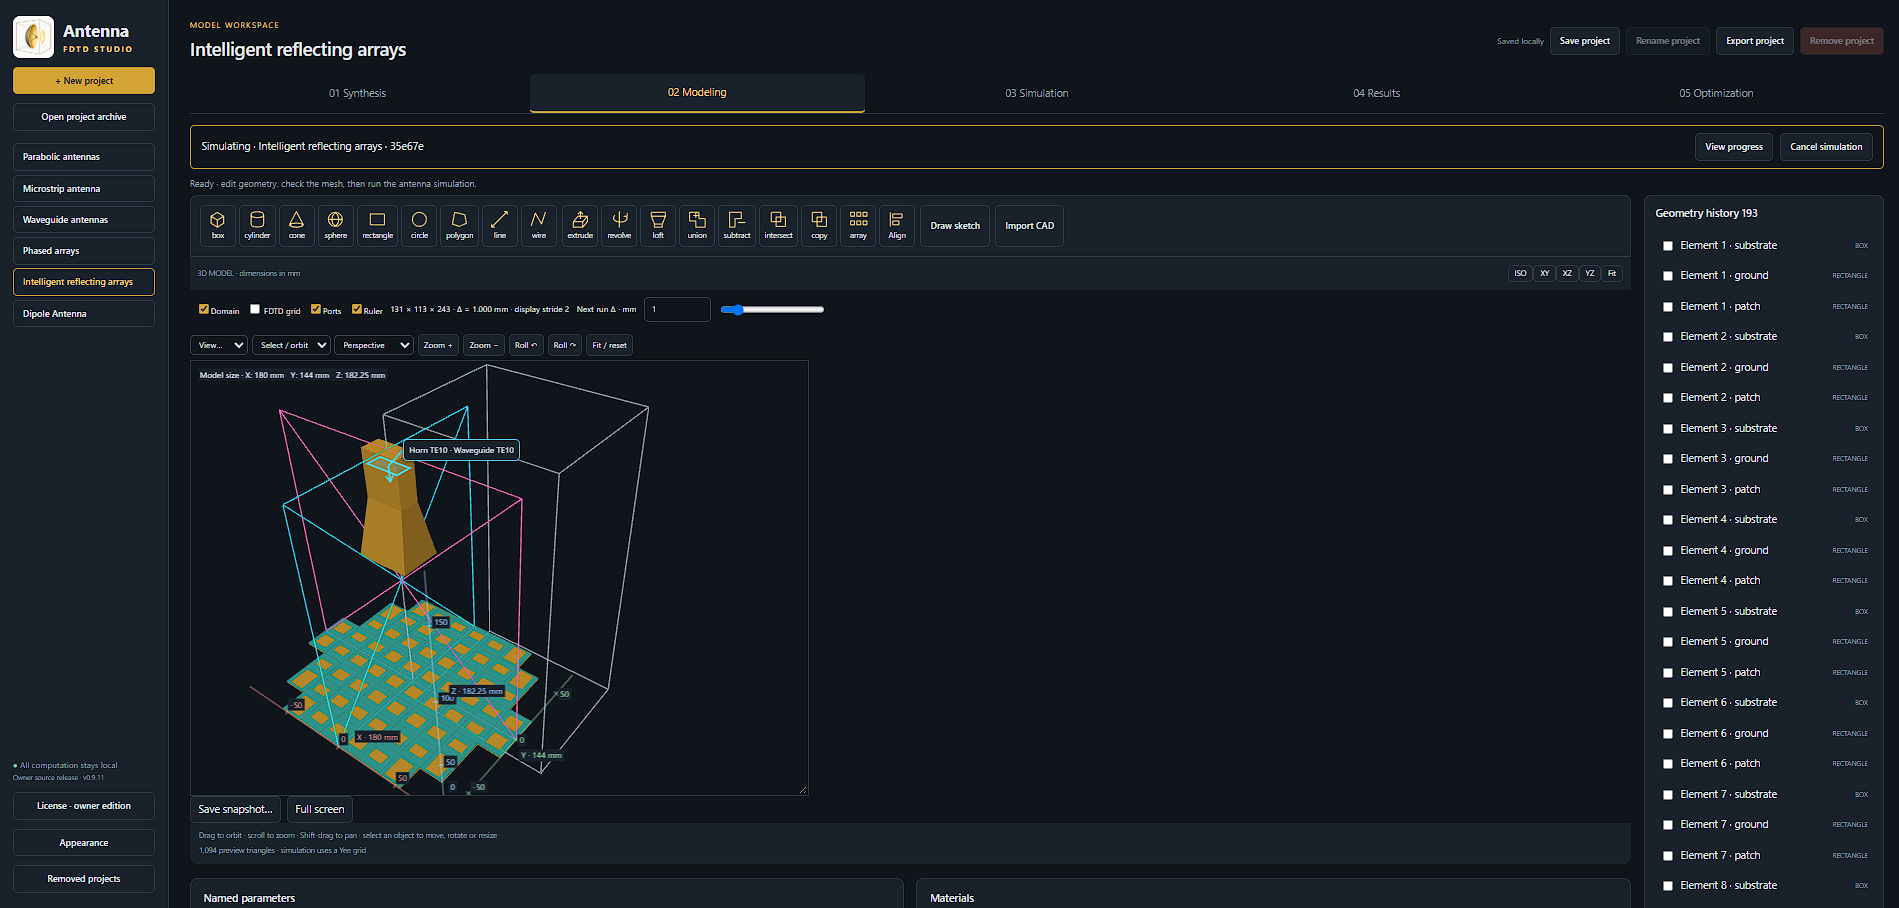
The supplied modeling workspace shows the horn feed above the reflecting array, with domain bounds, dimensions and element geometry history intact.
Horn-fed array modelThe supplied modeling workspace shows the horn feed above the reflecting array, with domain bounds, dimensions and element geometry history intact.
02 · RECORDED FIELDS

Follow the field across the array.

Recorded electromagnetic-field animation · all 24 exported frames, in their original order and at the original 12 fps playback rate.

03 · RADIATION PATTERNS

Explore the radiated response.
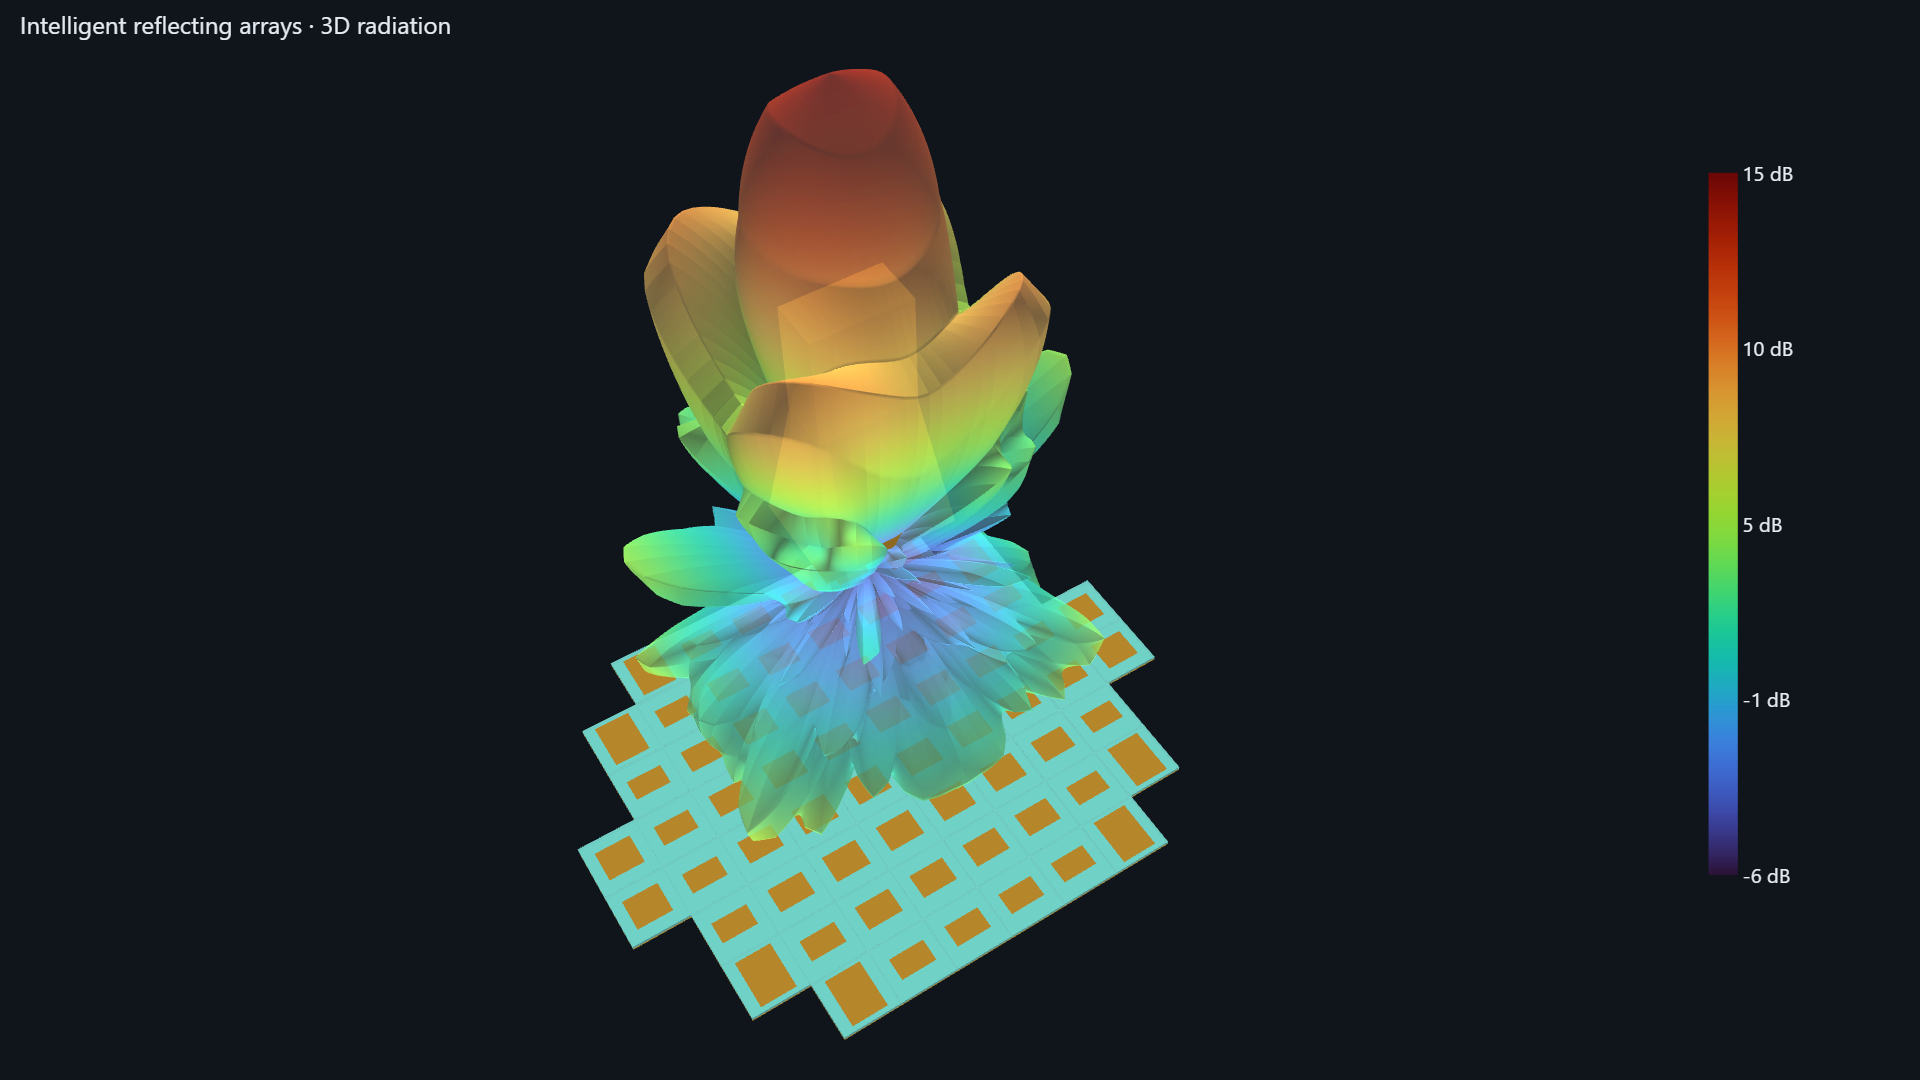
The supplied 3D radiation export, labeled Intelligent reflecting arrays, retains the array geometry and original −6 to 15 dB color scale.
3D radiation patternThe supplied 3D radiation export, labeled Intelligent reflecting arrays, retains the array geometry and original −6 to 15 dB color scale.
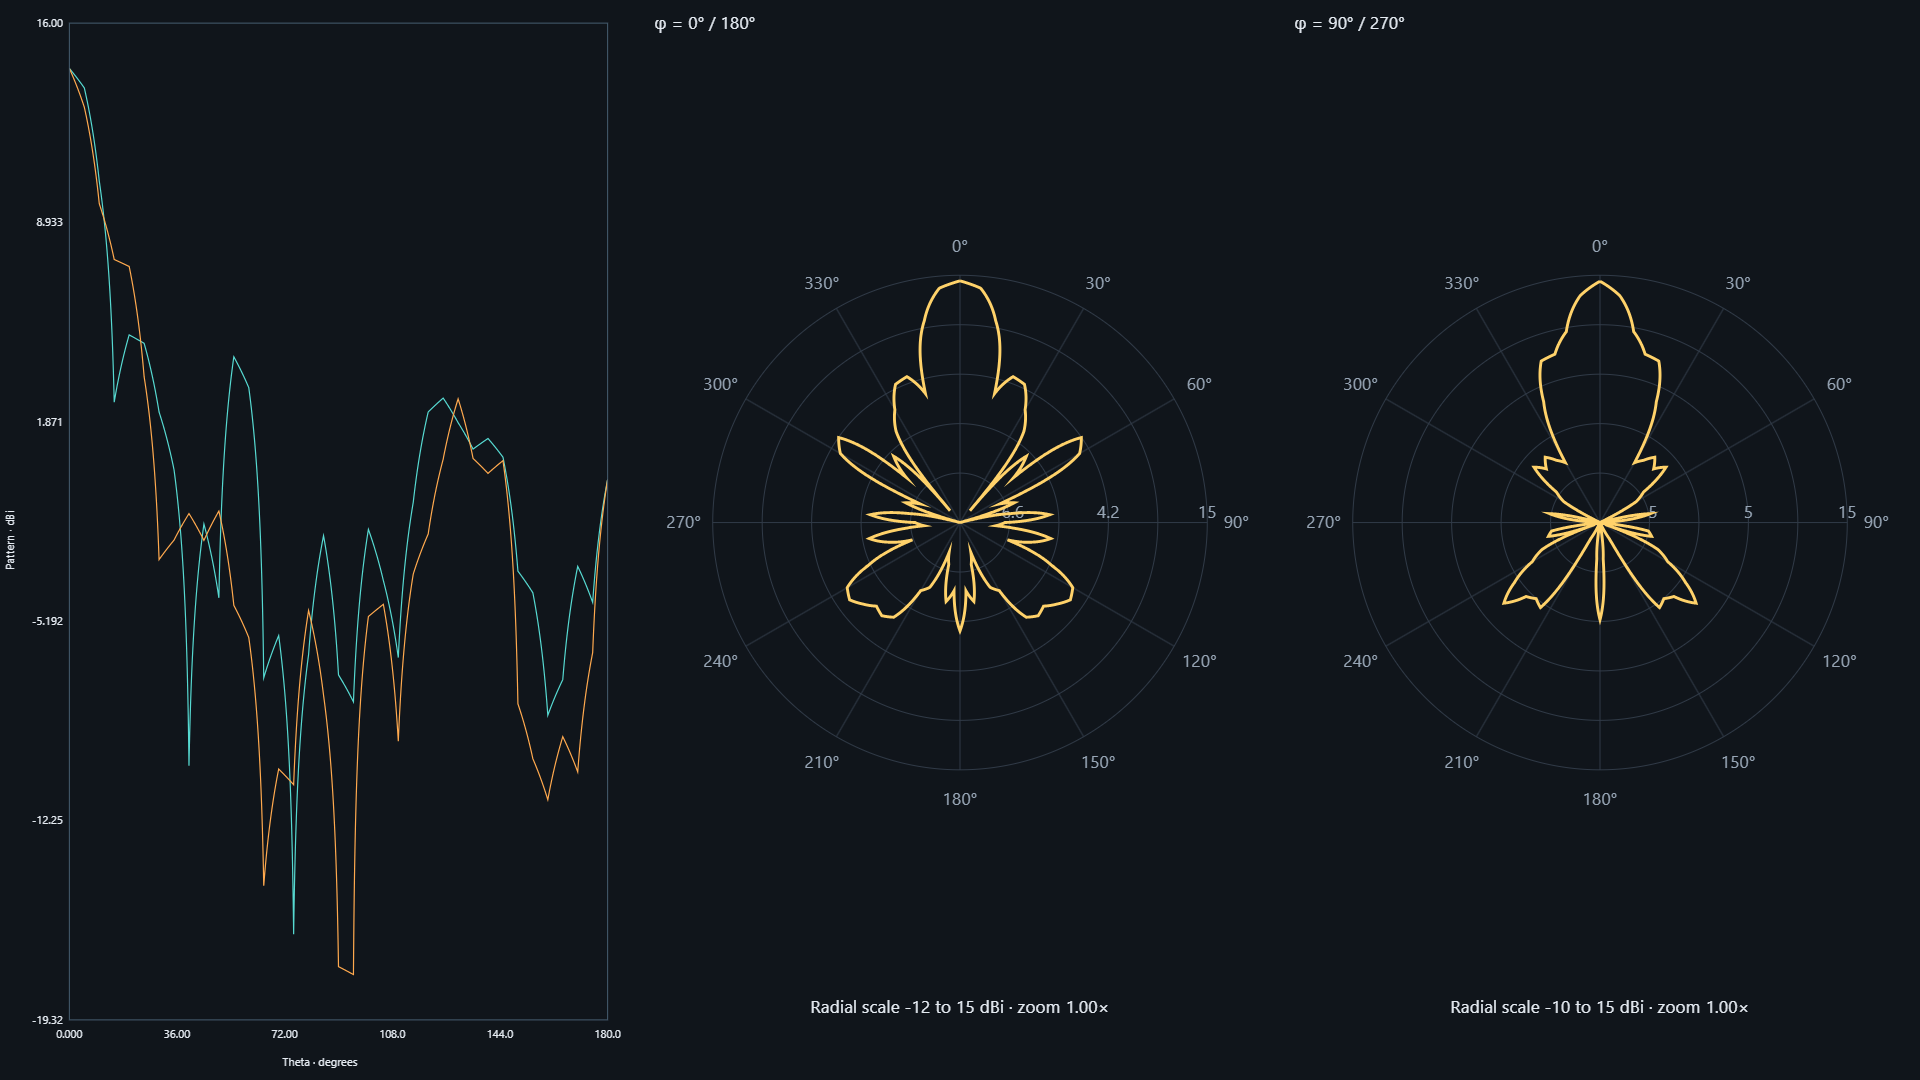
Pattern versus theta, alongside the φ = 0° / 180° and φ = 90° / 270° polar cuts. The original plots retain their respective −12 to 15 dBi and −10 to 15 dBi radial scales.
Radiation cutsPattern versus theta, alongside the φ = 0° / 180° and φ = 90° / 270° polar cuts. The original plots retain their respective −12 to 15 dBi and −10 to 15 dBi radial scales.
04 · FREQUENCY RESPONSE

Magnitude across frequency.
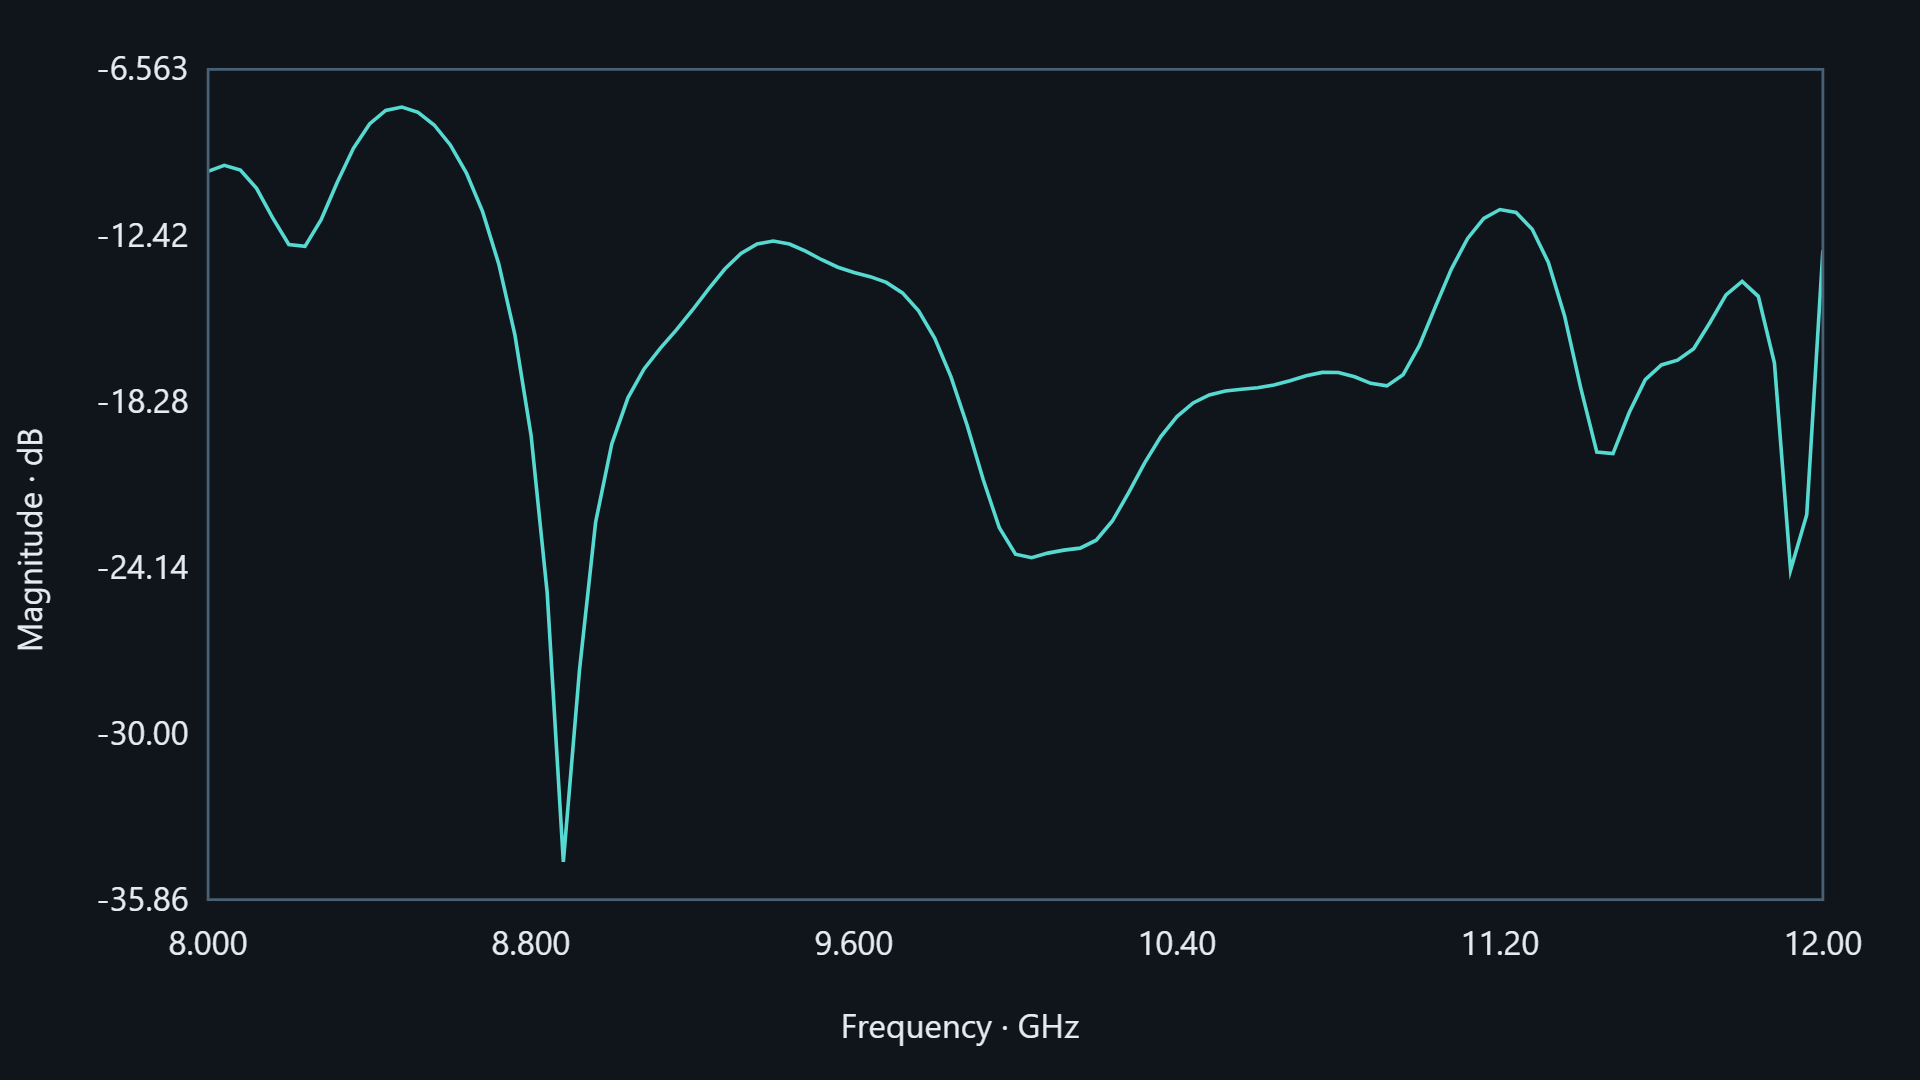
The supplied plot shows magnitude in dB versus frequency from 8 to 12 GHz. The export does not identify the specific S-parameter.
Magnitude · 8–12 GHzThe supplied plot shows magnitude in dB versus frequency from 8 to 12 GHz. The export does not identify the specific S-parameter.

Images retain the supplied pixels, axes and color scales. The workspace screenshots show a simulation in progress; the plots are separate supplied exports. The video is a web-playback copy of the supplied animation, preserving its frame count, dimensions and timing. This page presents the recorded material and does not run a solver.

Back to Antenna examples